
By Business Facilities Staff
From the July / August 2024 Issue
The Business Facilities 2024 Global Rankings focused on factors important to corporate relocation and expansion decisions. Now in its 20th year, these rankings are designed to provide quick insight for site selection projects across North America and beyond. The rankings look at recent activity and performance, as well as considering future opportunities emerging.
In Business Facilities’ 20th Annual Rankings Report, a global view looks at locations that are positioned to support the needs of businesses. The rankings showcase the variety of location choices for site selection projects across all types of business.
Global shifts due to supply chain, geopolitical events, extreme weather, and other factors are causing a shift in many economies around the world. There are instances of traditional leaders on the worldwide or regional stage are giving way to nations with nascent growth. Meanwhile, there are aspects of economic activity that are remaining on the same course as in past years.


An instance of staying on course is the FDI (Worldwide) ranking in the Global Rankings this year; once more, the United States ranks as the top destination to attract foreign direct investment. The U.S. has led in this category for more than 11 years, while the Inflation Reduction Act of 2022 ramped up interest from and action for companies from outside the country to invest. While 2023 cooled investment into the U.S. as compared to 2022.
The U.S. Bureau of Economic Analysis (BEA) reported that expenditures by foreign direct investors to “acquire, establish, or expand U.S. businesses” totaled $148.8 billion in 2023, according to preliminary statistics released in early July. Expenditures decreased $57.4 billion, or 28%, from $206.2 billion (revised) in 2022 and were below the annual average of $265.6 billion for 2014-2022. As in previous years, acquisitions of existing U.S. businesses accounted for most of the expenditures.
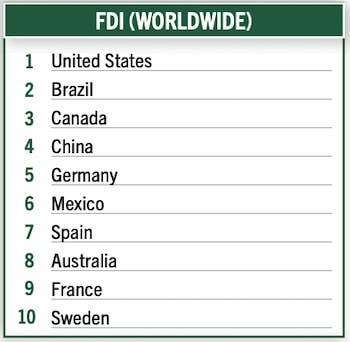


Meanwhile, the Organisation for Economic Co-operation and Development (OECD) reported these figures for the top three nations for inward FDI in 2023: FDI inflows to G20 economies decreased by 34%. They dropped by 28% in OECD G20 economies, and by 46% in non-OECD G20 economies, largely driven by reductions in China and, to a lesser extent, India. Despite this general downward trend in most economies, the United States remained the top destination for FDI inflows worldwide in 2023 (USD 341 billion), followed by Brazil and Canada.
NYC Remains Top Financial Center
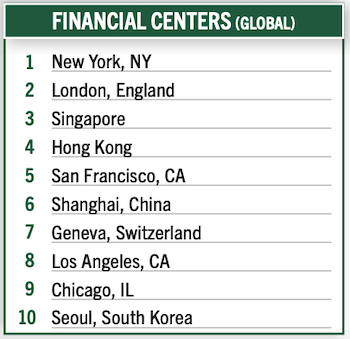
In the Financial Centers (Global) category, New York City once again landed in the top position, followed by London repeating at number two, Singapore at third, and Hong Kong remained at fourth. Geneva, Switzerland joined the Top 10 this year. The global financial centers ranking also includes San Francisco, CA; Shanghai; Los Angeles, CA; Chicago, IL; and Seoul, South Korea.
This year’s ranking took into account several factors, then weighed against the 35th edition of the Global Financial Centres Index (GFCI 35), published by Long Finance & Financial Centre Futures in March.
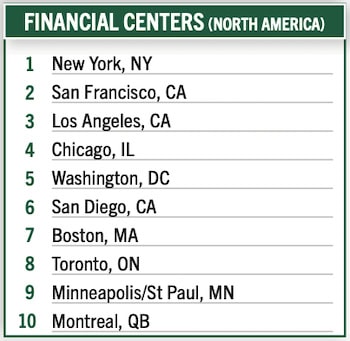
The Financial Centers (North America) ranking is also led by New York City, with San Francisco, CA; Los Angeles, CA; and Chicago, IL also retaining their positions from last year’s list. Washington, DC moved up one spot this year.
Artificial Intelligence: Growing The Ecosystem
It could be argued that 2023 was a breakout year for Artificial Intelligence. The well-regarded AI Index 2024 Annual Report by Stanford University points out that, on the technical front, this year’s AI Index reports that the number of new large language models released worldwide in 2023 doubled over the previous year.
Past years of Business Facilities’ AI ranking looked primarily at capital investments by nation. This year, the evaluation took into account the number of AI models, patents, and jobs. Capital investments remained in place this year.
An interesting finding from the AI Index report is where machine learning models are being developed. According to information in the report: Until 2014, academia led in the release of machine learning models. And that has changed. In 2023, there were 51 machine learning models produced by industry compared with15 from academia. And, 21 notable models were created in 2023 as a result of industry-academia collaborations, which represents a new high.
One reason for industry taking the lead? Creating cutting-edge AI models demands a substantial amount of data, computing power and financial resources, which are not typically accessible in academia.
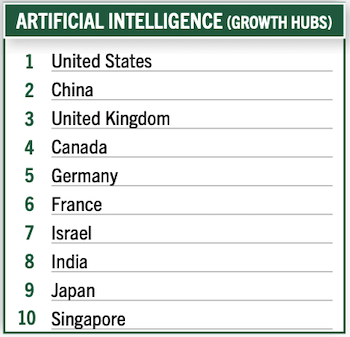
According to the Stanford report, the U.S. was the leader in number of foundational models originating there in 2023 (105). This was compared to China in the second position (20) and the United Kingdom (8).
Another key takeaway from the Stanford report, related to investments by nation: In 2023, the United States saw AI investments reach $67.2 billion, nearly 8.7 times more than China, the next highest investor.
While private AI investment in China and the European Union, including the United Kingdom, declined by 44.2% and 14.1%, respectively, since 2022, the United States experienced an increase of 22.1% in the same timeframe.
Rounding out the 10 nations ranked for Artificial Intelligence (Growth Hubs): Canada, Germany, France, Israel, India, Japan, and Singapore.


This year’s Global Rankings Report includes a look at the leading nations for Solar Power Installed Capacity and Wind Power Installed Capacity. And, this evaluation drew from data provided by The 2024 Statistical Review of World Energy, published for the past two years by the Energy Institute. Previously, bp had published the benchmark report for 70 years.
The ranking looks at installed capacity at the end of 2023, a year in which renewables (all types) accounted for 30% of total power generation globally.
China was the largest market for new solar and wind generation capacity additions last year: It accounted for about 25% of the world’s new solar generation in 2023 and approximately 66% of new wind generation.
The International Renewable Energy agency shared this data: In absolute terms of renewable electricity generation, Asia led the world in 2022, generating 3 749 TWh, a 9.3% increase driven by solar and hydropower, both offsetting declines in wind energy and bioenergy. North America came in second for the first time, with 1 493 TWh, up by 8.6% across energy sources, despite a drop in bioenergy. Europe generated 1 462 TWh a small 0.6% decrease from 2021. South America generated 940 TWh, showing an 11.9% increase from 2021 due to a hydropower recovery and a greater role of solar energy. And, In 2023, solar energy was the largest source of renewable capacity at 36.7% or 1 418 GW.
Solar Power, Worldwide
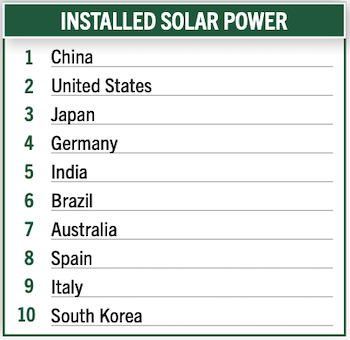
The top 5 nations for the Solar Power Installed Capacity in this year’s Business Facilities ranking are: China, United States, Japan, Germany, an India — positions each held in last year’s ranking. These are followed by Brazil, Australia, Spain, Italy, and South Korea.
Following are the countries that were the locations of the largest amount of installed solar capacity in 2023, comprised of photovoltaic (PV) and concentrating solar power (CSP), according to the report:

New to the Top 10 for Solar Power Installed Capacity this year are Australia at 7 and Spain at 8.
Wind Power, Worldwide

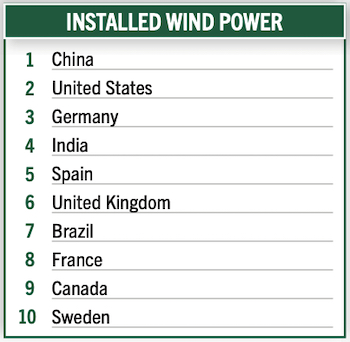
For the Wind Power Installed Capacity ranking, China and the U.S. are leading and followed by Germany, India, Spain, United Kingdom, Brazil, France, Canada, and Sweden.
The Top 5 in this year’s wind power ranking were reported to have the following installed capacity at the end of 2023:
China: 441,895MW of wind powerUnited States: 148,020 MWGermany: 69,459 MWIndia: 44,736 MWSpain: 31,028 MW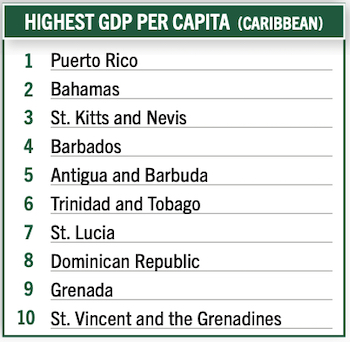
The Caribbean is enticing to business for many reasons. From pharmaceuticals to professional services, these locations are profitable for many. This year’s rankings took a look at Caribbean locations and their GDP per capita. Puerto Rico led the pack, followed by Bahamas, and St. Kitts and Nevis in the Top 3. The others leading the region are Barbados, Antigua and Barbuda, Trinidad and Tobago, St. Lucia, Dominican Republic, and Grenada.
Canada: FDI And Tech Talent
Canada ranked third for FDI (Worldwide) in this year’s rankings, and according to OECD inward investment during 2023 totaled $62.3 billion, with 660 projects announced. According to Invest in Canada, there was strong growth across most industries. Investments in Canada’s electric vehicle supply chain account for a steep jump in manufacturing FDI flows, outpacing the 10-year average by nearly $6 billion.
A notable statistic from Invest in Canada: In 2023, 29% of all inbound FDI to Canada was sustainable projects, marking a significant increase from 5-year and 10-year averages. Sustainable FDI in 2023 reached $26.7 billion, nearly triple the 5-year average of $9.7 billion.
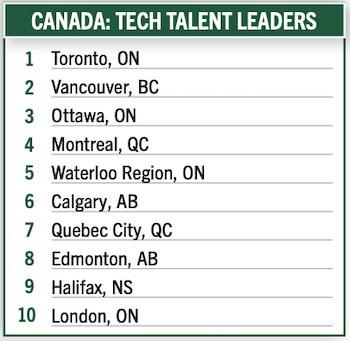
Whether FDI or domestic investment, the workforce and available talent is crucial to companies across all industries. Canada has one of the most educated workforces in the world, and tech talent in the country is well-known. The Business Facilities ranking looked at cities that are Tech Talent Leaders throughout Canada.
Based on prevalence of available labor and related resources, Toronto, ON led the list this year. The Top 5 cities throughout Canada also include Vancouver, BC; Ottawa, ON; Montreal, QB; and Waterloo Region, ON.
Canada: Renewable Energy Activity
With investments into the green economy steadily coming into Canada, it’s interesting to see what provinces in the nation are leading the way with renewable energy infrastructure.
This year’s Business Facilities rankings include a look at Canada’s renewable energy generation and installed capacity by province. Based on figures from Statistics Canada, an agency of the national government and data from the Canadian Renewable Energy Association, evaluations include Solar Energy, WInd Energy, and Hydroelectric Energy for 2023.
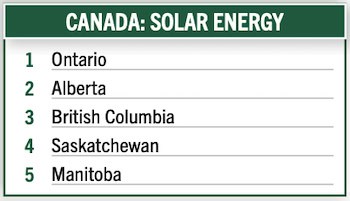
Ontario is the leading province for Solar Energy, followed by Alberta, British Columbia, Saskatchewan, and Manitoba.
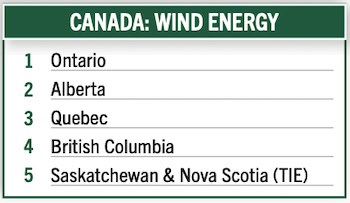
When it comes to Wind Energy, Ontario and Alberta top the list again. These two provinces are followed by Quebec, British Columbia, Saskatchewan, and Nova Scotia.


Hydroelectricity is a vital part of Canada’s energy mix, reportedly accounting for more than 60% of the country’s electricity generation in 2022. Canada is the world’s third largest producer of hydroelectricity. With that in mind, the rankings this year looked at the top provinces for hydroelectric power.
The leader in this category is Quebec, followed by British Columbia, Newfoundland and Labrador, Ontario, and Manitoba.
According to the Canada Renewable Energy Association (CanREA), Alberta accounted for more than 92% of Canada’s overall growth in renewable energy and energy-storage capacity in 2023.
The province saw steady, reliable growth again this year, on both the solar and wind fronts. Alberta added 2.2 GW of installed capacity this year (including 1,671 MW wind, 329 MW utility-scale solar, 24 MW of on-site solar, and 130 MW of energy storage), compared to its 1.4 GW increase last year.


CanREA highlighted Ontario’s installed capacity is still the largest in Canada, at more than 7.5 GW (5.5 wind, nearly 2 solar, more than 100 MW storage). While this total did not increase in 2023, that is expected to change soon, as Ontario invests in energy storage.
CanREA is tracking 429 MW of storage projects that are already in advanced development, including the 250 MW Oneida Project (led by CanREA members Northland Power, Six Nations of the Grand River Development Corporation and Aecon, as well as NRStor), and another 407 MW in proposed energy-storage projects.
The Annual Global Rankings provide a snapshot of important site selection factors. View the lists in this section for a closer look.
Continue reading Business Facilities’ 20th Annual Rankings Report:
2024 State and Metro Rankings
Source link : http://www.bing.com/news/apiclick.aspx?ref=FexRss&aid=&tid=66b50a9a622c4b83b9c5ed3851bcdc54&url=https%3A%2F%2Fbusinessfacilities.com%2F20th-annual-rankings-report-2024-global-rankings%2F&c=1172543217563438384&mkt=en-us
Author :
Publish date : 2024-08-08 06:59:00
Copyright for syndicated content belongs to the linked Source.