

By Business Facilities Staff
From the July / August 2024 Issue
Business leaders planning relocation or expansion projects consider a range of factors for site selection while also looking at resources such as tech infrastructure, partnerships, and renewable energy. In the 2024 State Rankings section of this 20th Annual Rankings Report from Business Facilities, we look at broad factors like Best Business Climate while also providing insight into a range of other factors for site selection decisions. At the Metro and Global level, rankings include Tech Talent to Fastest Growing Cities. The Global rankings specifically look at categories impacting site selection decisions across borders.
2024 State Rankings
The Business Facilities 2024 State Rankings include more than 20 categories focused on factors important to corporate relocation and expansion decisions. Now in its 20th year, these rankings are designed to provide quick insight for site selection projects across North America and beyond. The rankings look at recent activity and performance, as well as considering future opportunities emerging in these states and provinces.

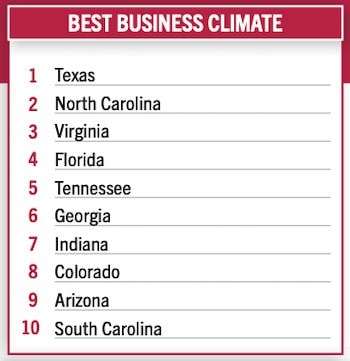
Texas Best Business Climate

With a low tax burden, incentives that support growing and legacy industries, vast higher education institutions, and steady population growth, Texas is the leader in Best Business Climate in this year’s Business Facilities rankings. These factors, along with other developments across the Lone Star State, combine to offer an environment where businesses across varied industries have the opportunity to thrive.
Throughout the state’s 254 counties, government and economic development leaders focus on maintaining the business-friendly environment. On the state level, incentives and programs support these efforts, ultimately supporting the companies doing business in the state.
Incentives and legislation put in place during 2023 include the Jobs, Energy, Technology & Innovation (JETI) Act (or House Bill 5) offering tax abatements and other incentives for large-scale business developments, expansions, and relocations. Also passed in 2023, the Texas CHIPS Act created the Texas Semiconductor Innovation Consortium (TSIC) and Texas Semiconductor Innovation Fund (TSIF). Other new programs include the creation of the Texas Space Commission and the Texas Aerospace Research & Space Economy Consortium and the Texas Small & Rural Community Success Fund Program.
Home to 54 Fortune 500 companies, Texas offers a healthy business climate and many economic development opportunities. The state is now home to more Fortune 500 companies than any other state in the nation.
In a state has large as the Lone Star State, diversity abounds. Just a few instances: North Texas boasts the second-largest metropolitan area in the United States and is a magnet for corporate headquarters. South Texas borders Mexico and offers businesses access to the four Foreign Trade Zones (FTZs) to facilitate cross-border trade. Central Texas is known for its diverse business sectors and is home to seven top-ranking colleges and universities to contribute to the young, growing talent pipeline.
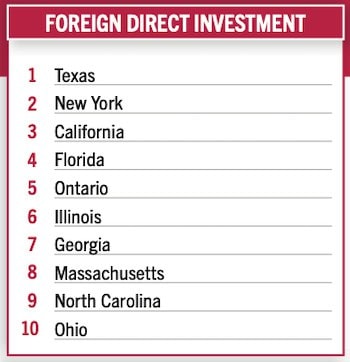
Texas has also been recognized in the top spot for Foreign Direct Investment. In 2023, the state attracted $20 billion across more than 230 projects. New York and California are also in the Top 3 for FDI attraction last year.
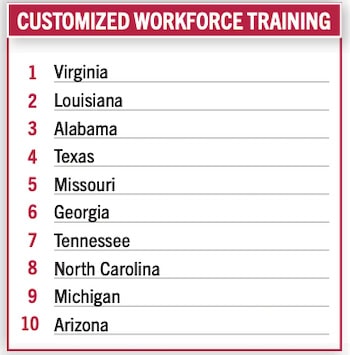


Virginia’s top-notch Customized Workforce Program is ranked No. 1 in the Business Facilities rankings for the second consecutive year. The Virginia Talent Accelerator Program, launched in 2019 by the Virginia Economic Development Partnership, operates in partnership with the Virginia Community College System and other higher education institutions.
Instrumental in securing more than 13,000 jobs across the state since its inception, the Virginia Talent Accelerator Program provides customized direct delivery of recruitment and training services to meet a company’s specific needs, including processes, standards, and culture. Delivered at no cost to eligible companies as it relates to job creation, the program offers broad expertise for training curriculum, including hands-on and printed materials to video and e-learning. Other assistance may include creation of hiring websites and advertising spots on streaming platforms in target talent markets, as well as training in organizational development.
Companies announcing participation in the program have included Northrup Grumman for an electronics manufacturing and testing facility in Waynesboro in 2023. Recently, Condair Group AG announced it will participate in the Virginia Talent Accelerator Program as it establishes a new evaporative cooling manufacturing facility in Chesterfield County.

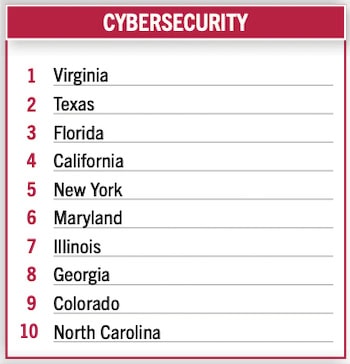
Virginia is also ranked at the top of the Cybersecurity category. Based on access to talent in this field, number of National Centers of Academic Excellence in Cybersecurity (NCAE-C), and other resources, the state is recognized to possess a significant cybersecurity infrastructure.
As part of the drive to expand its tech talent, Virginia has a strong focus on skilled cybersecurity workers. In this year’s rankings, BF recognizes initiatives in that sphere, including the close to 50 colleges and universities that have established cyber degrees. Virginia is also home to more than 20 NSA/DHS Centers of Academic Excellence (CAE) in cybersecurity.
For Customized Workforce Training, Louisiana takes the No. 2 place. Administered by Louisiana Economic Development (LED), the LED FastStart program continues its strong push toward equipping its workforce with the skills being sought by new and expanding companies.
The LED Fast Start Program is based on that full life-cycle of training talent for a company that creates jobs in the state. The program’s recruiting aspect uses a next-generation workforce hiring platform that allows job seekers to interact with hiring companies in dynamic ways. Other recruiting aspects include virtual job fairs and targeted recruiting.
Training is customized for the company and jobs that need to be filled. Sustain includes involvement with the education system, including investment in higher education to advance curricula and training in software, digital and IT services, advanced manufacturing, and STEM-related disciplines.
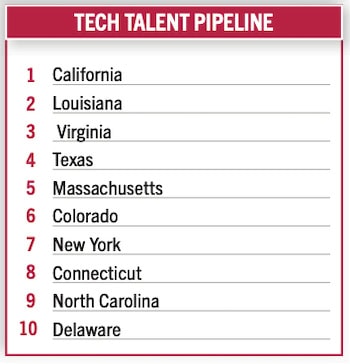
California, Louisiana Top Tech Talent Pipeline
Focused on a state’s strategy and results related to workforce availability for technology-related jobs across all industries, the Tech Talent Pipeline category evaluates investments in developing tech talent, STEM-oriented education programs and partnerships, innovative tools, and the results a program delivers.
This year’s ranking also takes into account the sheer number of tech talent available, and California followed by Louisiana takes the lead when that factor is weighed in. As companies around the globe continue to place a priority on streamlining hiring and retention, California’s tech industry infrastructure, education institutions, and research ecosystem offer an established foundation for companies of all sizes.
Louisiana took the No.2 spot for Tech Talent Pipeline, and is recognized for an impressive and proactive focus on expanding the skilled tech workforce through programs that are delivering results. Also noteworthy is the state’s initiatives toward developing its skilled workforce for a burgeoning renewable energy industry.

A bevy of tech-focused economic development initiatives and incentives, such as the Small Business Innovation and Research grant match program, has established Louisiana as a standout state for tech companies. Meanwhile, investment into the Cyber Corridor in the northern part of the state are drawing academia, industry, and government resources and supporting the demand for talent in cybersecurity.
In Virginia, the Top 3 ranked state for Tech Talent Pipeline this year, tech talent is inherent to its world-class higher education institutions and proximity to federal government agencies and resources. The Tech Talent Investment Program from the Virginia Economic Development Partnership aims to create and maintain the state’s tech talent.
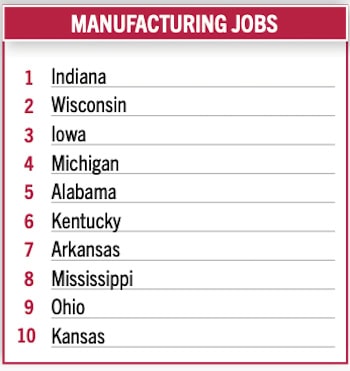
Manufacturing: Jobs As Barometer
The Manufacturing ranking focused on jobs this year, with Indiana taking the top spot, based on the most recent data from the U.S. Bureau of Labor Statistics, National Association of Manufacturing, and statistics available from the states. In addition to sheer numbers, concentration of employment in manufacturing also factored in the ranking.
The other leading states in this year’s Top 10 are: Wisconsin, Iowa, Michigan, Alabama, Kentucky, Arkansas, Mississippi, Ohio, and Kansas.
In Indiana, manufacturing jobs will continue to grow in the coming years with new projects, large and small, choosing to expand in the state. In April 2023, Michigan-based GM and South Korea-based Samsung SDI announced a joint venture that is expected to create 1,700 manufacturing jobs to the state. Currently under construction, a new electric vehicle battery cell plant in St. Joseph County represents a $3 billion investment and is planned to be operational in 2026.
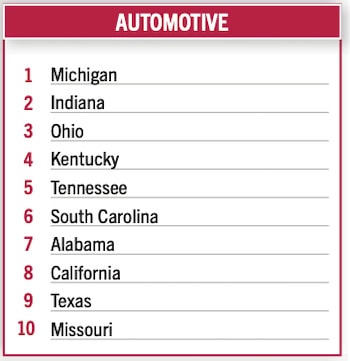


This year’s Automotive ranking is once again led by Michigan, which continues to build on its long history as an industry leader. The ranking takes into account employment, with consideration for job count increases over the past year, as well as relocation and expansion investments and export figures.
Indiana and Ohio are ranked second and third, respectively — positions these states held in last year’s lineup. Rounding out the category are: Kentucky, Tennessee, South Carolina, Alabama, California, Texas, and Missouri.
South Carolina joins the Top 10 in Automotive this year, mainly based on its auto exports activity in recent years.
According to the National Automobile Dealers Association (NADA), in 2023 new light-vehicle sales totaled 15.46 million units, up 12.4% from 2022. For all vehicle types, both fleet and retail sales increased in 2023. NADA also reported that light trucks represented 80% of all new vehicles sold in 2023—an increase of 0.8% from 2022. Crossovers were once again the most popular segment in 2023, representing 47.9% of all new light vehicles sold and up 2.6 percentage points from 2022.
In 2023, NADA’s data shows that battery electric vehicle (BEV) sales topped 1.1 million units for the first time and made up 7.2% of all new light vehicles sold. Sales of hybrids and plug-in hybrids (PHEVs) also grew in 2023. In 2023, 7.6% of new vehicle sales were hybrids and 1.9% of new vehicles sales were PHEVs, representing market share increases of 2% and 0.6%, respectively.
NADA also reported that alternative fuel vehicles gained market share, as sales of hybrids, plug-in hybrids, and battery electric vehicles accounted for 12.3% of new vehicles sold. That was an increase of 2.7% compared to 2021.
There have been bumps in the road for the EV industry in 2024. Some companies are slowing their planned or in-progress investments into manufacturing plants. Still, the industry is moving forward.
The EV Investment ranking looks at capital investments over a number of years. Georgia moved to the No. 1 spot this year, having been ranked No. 3 last year. Since 2018, more than $27 billion of investment in the EV industry have been announced in the state.


In 2022, Hyundai Motor Group selected Bryan County, GA for the site of its Hyundai Motor Group Metaplant America (HMGMA). Nearing completion currently, the $7.59 billion electric vehicle and battery manufacturing facility is expected to create more than 8,000 jobs for residents.
In this ranking, Michigan is No. 2 with more than $20 billion in EV industry investment since 2015, with that number continuing to rise.
North Carolina moved to No. 3 — up from eighth in last year’s list. The Tar Heel State’s showed an influx of $9 billion in announced EV investments, just during the six months prior to a report released by the Environmental Defense Fund (EDF) in March 2024.
The EDF report, “U.S. Electric Vehicle Manufacturing Investments and Jobs,” looks at announced investments for the EV Industry across the U.S., and by state. The operations included in the data are EVs, EV batteries, battery components, and battery recycling. The EDF study also includes announced job creation and retention. The timeframe is multi-year, from 2015 to February 2024.
Rounding out the EV Investment ranking are: Tennessee, Nevada, South Carolina, Ohio, Indiana, and Illinois.
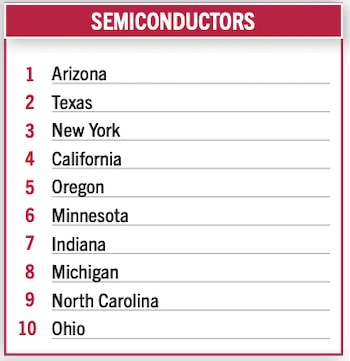
Semiconductor: States Are Driving Growth
The semiconductor industry is continuing its growth in U.S., with investments spurred by the CHIPS and Science Act, which was enacted in 2022. Since 2021, semiconductor employment has increased by an average of 4.3% per year since 2021, reaching over 203,000 workers in 2023, according to the Semiconductor Industry Association. This is despite a significant easing in the shortage of legacy semiconductors since early 2023. The U.S. is projected to triple its fab capacity from 2022 to 2032, which would be the first time in decades that the U.S. has increased its domestic chip manufacturing footprint relative to the rest of the world.
The Business Facilities rankings of states leading in the Semiconductors industry considering investments, labor availability, incentives, and partnerships.
The No. 1 state this year is Arizona, moving up from occupying No. 2 in last year’s ranking. Arizona leads the nation in semiconductor investment, supplier expansions and jobs. Since 2020, Arizona has attracted more than 40 semiconductor expansions, representing over $102 billion in capital investment and over 15,700 direct industry jobs.
Rounding out the Top 10 are: Texas, New York, California, Oregon, Minnesota, Indiana, Michigan, North Carolina, and Ohio.
Outdoor Recreation Is Big Business
The outdoor recreation economy is a significant and growing contributor to the U.S. economy, as measured by the Outdoor Recreation Satellite Account (ORSA), produced by the Bureau of Economic Analysis of the U.S. Department of Commerce.

In 2022, the outdoor recreation economy generated $1.1 trillion dollars in economic output. The value added from this sector was $564 billion, representing 2.2% of the nation’s gross domestic product (GDP). This is more than three times the size of air transportation, two-and-a-half times the size of oil and gas development, and nearly three-and-a-half times the size of motor vehicle manufacturing and performing arts.
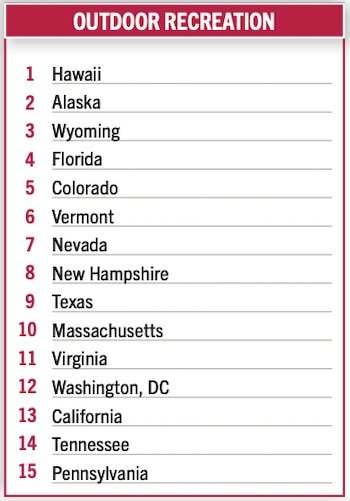
Evaluated by the industry’s contribution to state GDP as well as concentration of employment there, the No. 1 for Outdoor Recreation is Hawaii.
Rounding out the list of 15 are: Alaska, Wyoming, Florida, Colorado, Vermont, Nevada, New Hampshire, Texas, Massachusetts, Virginia, Washington, DC, California, Tennessee, and Pennsylvania.
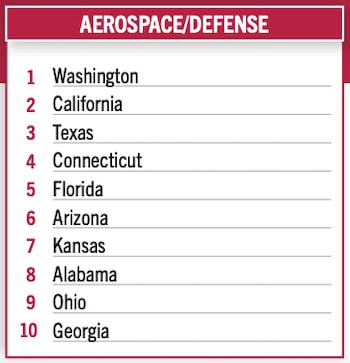
Washington, California, Texas: Aerospace & Defense Leaders
In this year’s rankings, top states for Aerospace/Defense firms and related businesses include Washington, California, and Texas — these are the same leaders as last year’s Business Facilities rankings. This is based on existing companies and industry ecosystem, jobs available, and recent and planned investments.
The Top 10 list is rounded out with: Connecticut, Florida, Arizona, Kansas, Alabama, Ohio, and Georgia.
The state of the aerospace and defense industry is strong, and continues to grow. That’s according to Facts and Figures, a September 2023 report from The Aerospace Industries Association (AIA) in collaboration with IHS Markit. Drawing on 2022 data, the report provides a snapshot of the aerospace and defense industry’s workforce, wages, sales, and other trade statistics.
A return to air travel and a continuation of the need for national defense are driving the growth of the industry, and at the center of this growth is its workforce. The report noted that in 2022 the aerospace and defense workforce totaled more than 2.2 million. Returning to pre-pandemic numbers, the industry workforce increased by more than 101,000 in 2022, a 4.87% increase from 2021.
According to the AIA report, the supply chain, including small- and mid-sized businesses, drives the majority — nearly 58% — of industry employment. Fifty-seven percent of employment comes from the commercial aerospace sector, while defense and national security employment makes up the remaining 43%.
Texas, New York Tops For FDI Projects
For over a decade, the U.S. has ranked as the top destination for international companies to set down roots and achieve their expansion goals,” stated U.S. Secretary of Commerce Gina Raimondo in Kearney’s Global Business Policy Council’s 2023 Foreign Direct Investment Confidence Index. “The United States’ diverse landscapes, vast resources, skilled workforce, and spirit of innovation and entrepreneurship are just a few of the reasons why investors choose to settle here.”
The Business Facilities rankings reveals which states and Canada provinces attracted the highest number of foreign direct investment (FDI) projects.
For FDI (Projects), the leading state based on 2023 data is Texas, attracting more than 230 investments in FDI that year. The Lone Star State moved up from No. 2 in last year’s rankings.
Taking No. 2 this year is New York (197 projects), California (170), Florida (136), Ontario in Canada (129), Illinois (81), Georgia (75), Massachusetts (69), North Carolina (63), and Ohio (59).
According to that Confidence Index from Kearney, the U.S. has been ranked as the top destination in the world for foreign direct investment (FDI) for 11 consecutive years, thanks to its large consumer base, a predictable and transparent justice system, a productive workforce, a highly developed infrastructure and a business environment that fosters innovation.
The U.S. International Trade Administration says that FDI accounts for nearly 16% of U.S. business research and development (R&D) and directly supports almost eight million jobs across the nation. The main investing countries in the U.S. are Japan, Germany, Canada, the United Kingdom, Ireland, and France. Most of these investments are in manufacturing, financial and insurance activities, and trade and maintenance.
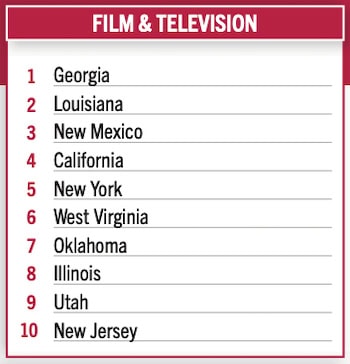

Entertainment is big business, and the film and television industry is steadily making its mark in economic development. Film and television production operations, and related work such as digital media, create jobs and stimulate local economies in numerous other ways.
Since 2021, with the economy well on the rebound after the pandemic, at least 18 states have enacted measures to implement or expand film tax incentives. As of March 2024, according to the National Conference of State Legislatures, 38 states offer some form of incentive to film and television productions.
Based on economic impact and incentive levels for production operations, the leading three states for this year’s Business Facilities Film & Television ranking are: Georgia, Louisiana, and New Mexico—these were the Top 3 ranked states last year, for a repeat showing.
The others leading the U.S. for incentives and resulting economic impact in 2023, and back into 2022 are: California, New York, West Virginia, Oklahoma, Illinois, Utah, New Jersey.
Life Sciences Leaders
The life sciences sector continues to see significant growth. The life science tools market was valued at $111.28 billion in 2022 and is expected to grow to $367.16 billion by 2032, with a compound annual growth rate (CAGR) of 13% between 2023 and 2032. The global life science analytics market was valued at $15.27 billion in 2023 and is expected to grow to $43.86 billion by 2032, with a CAGR of 11.8%.
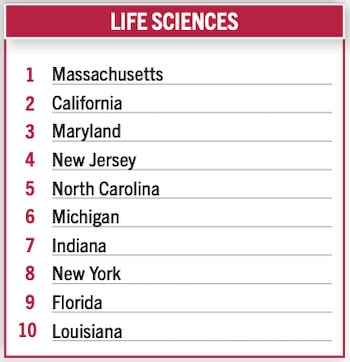
This year’s Life Sciences Leaders rankings evaluated states by cross-referencing the crucial factors for companies in this sector. The Top 4 ranked states — Massachusetts, California, Maryland, and New Jersey. These states occupied these same places in last year’s ranking.
Rounding out the Top 10 Life Sciences Leaders are North Carolina, Michigan, Indiana, New York, Florida, Louisiana.
The factors evaluated included: Proximity to Academic and Research Institution; Skilled Workforce; Access to Funding; Infrastructure; Regulatory Environment; Industry Clusters: Incentives/Tax Breaks; Access to Markets; Innovation Culture.


Medical device and equipment manufacturers employ nearly 400,000 in the U.S., accounting for 19% of the nation’s biosciences jobs. That’s according to the most recent TEConomy/BIO report, “The U.S. Bioscience Industry: Fostering Innovation and Driving America’s Economy Forward.” And, since 2018, the subsector has grown by 5.5% and has averaged 1.8% growth annually, about the same average growth rate seen since 2015 for medical device jobs, stated the report.
Performance across the individual component sectors has been mixed, with strong double-digit job growth in electromedical equipment production and analytical lab instruments and above-average growth in medical and surgical instrument manufacturing offset by slower growth in other sectors.
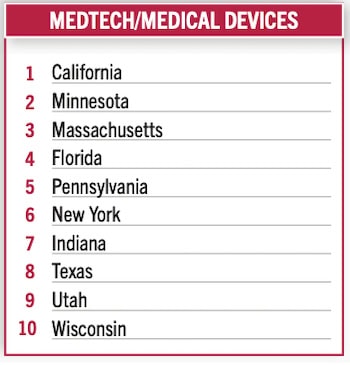
Based in part on U.S. Bureau of Labor statistics and data from the TEConomy/BIO report, Business Facilities ranked Massachusetts, California, and Maryland as the Top 3 states for Medtech/Medical Devices. Employment growth, employment concentration, and a specialized concentration of jobs was taken into account.
Rounding out this ranking are: New Jersey, North Carolina, Michigan, Indiana, New York, Florida, and Louisiana.
Population Growth A Boost In Search For Talent
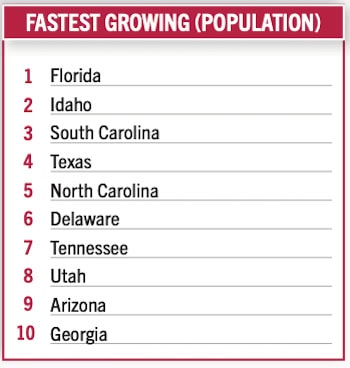
Workforce training and talent pipelines depend on availability of potential employees. While current residents are certainly an asset, with today’s migration activity across state lines the rate of population growth is as factor to take note of in site selection.
This year’s Population Growth rankings looked at U.S. Census Bureau data from July 2022-July 2023, with taking into account growth by number, and also by percentage. Florida is the leader in the ranking. The following states are also leaders in population growth: Idaho, South Carolina, Texas, North Carolina, Delaware, Tennessee, Utah, Arizona, Georgia.
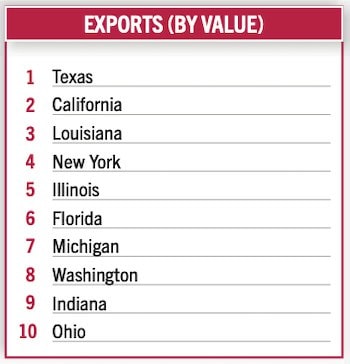
States Leading Exports, Top GDP Locations
Based on 2023 data from the International Trade Administration, the top 10 U.S. states for exports are:
Texas: $444.6 billionCalifornia: $178.7 billionLouisiana: $100.2 billionNew York: $97.8 billionIllinois: $78.7 billionFlorida: $68.9 billionMichigan: $64.9 billionWashington: $61.2 billionIndiana: $56.1 billionOhio: $55.8 billion
These states lead the nation in export values, with Texas consistently at the top due to its significant exports of petroleum and coal products, among other goods. California follows with substantial exports in technology and machinery.
Other states like Louisiana, New York, and Illinois contribute significantly through a mix of natural resources, technology, and manufacturing exports
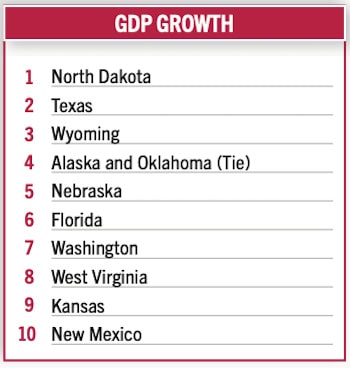
In the first quarter of 2024, real GDP for the nation grew at an annual rate of 1.4 percent, according to the U.S. Bureau of Economic Analysis. Real GDP increased in 15 of the 23 industry groups for which BEA prepares quarterly state estimates (table 2). Retail trade, construction, finance and insurance, and health care and social assistance were the leading contributors to growth in real GDP nationally.
The leaders in this year’s GDP Growth ranking are: North Dakota (5.9%), Texas (5.7%), and Wyoming. Rounding out the ranking are: Alaska, Oklahoma, Nebraska, Florida, Washington, West Virginia, Kansas, and New Mexico.
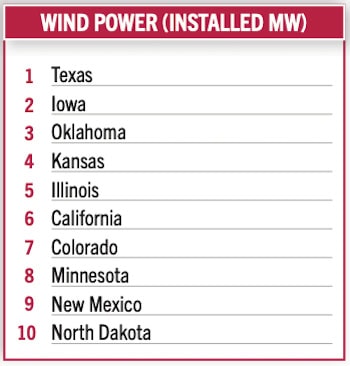
Solar Energy Sweeping The Nation
In 2023, the U.S. solar market installed 32.4 GWdc of capacity, a 51% increase from 2022, reported the Solar Energy Industries Association in its 2023 Year in Review report. This was the industry’s biggest year exceeding 30 GWdc of capacity for the first time.
Solar accounted for 53% of all new electricity-generating capacity added to the U.S. grid in 2023, making up over half of new generating capacity for the first time.
The commercial solar segment broke an annual record that has stood since 2017, with 1,851 MWdc installed, growing 19% over 2022. Fourth quarter volumes in California doubled from their typical range as the commercial sector started to see the same surge of installations caused by the switch to net billing.
The utility-scale segment installed a record-breaking 22.5 GWdc in 2023, representing 77% annual growth and nearly 10 GWdc more than 2022. More than 10 GWdc was installed in the fourth quarter. This growth underscores the market impact of supply chain constraints in 2022. Many of the projects completed in 2023 represent delayed buildout of 2022 pipelines.
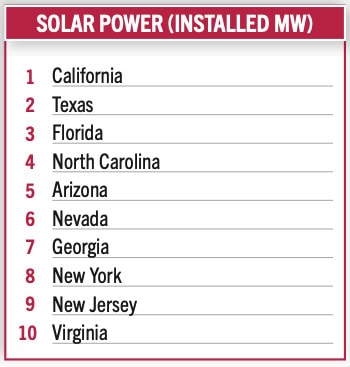
Business Facilities’ Solar rankings this year reflect this activity. Here are the top ranked states for Solar Power (Installed MW): California, Texas, Florida, North Carolina, Arizona, Nevada, Georgia, New York, New Jersey, and Virginia.
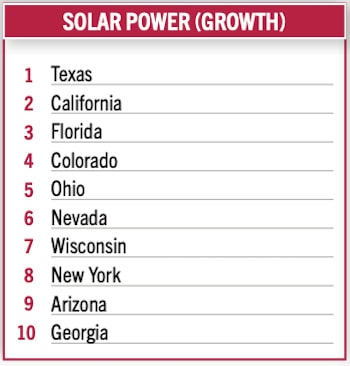
The Solar Power (Growth) ranking is led by Texas, followed by California, Florida, Colorado, Ohio, Nevada, Wisconsin, New York, Arizona, and Georgia.
Looking at the big picture, the SEIA report states 2023 was a year of recovery for the U.S. solar industry. After installation volumes shrank 9% in 2022 due to various trade actions impacting solar imports, supply chain stability helped the industry get back to business in 2023. The SEIA expects this momentum to continue into 2024, “albeit at a lower growth rate since 2023 installations were record-breaking due to delayed 2022 projects coming to fruition in 2023.”
Continue reading Business Facilities’ 20th Annual Rankings Report:
2024 Metro and Global Rankings2024 Annual Rankings Sources & Methodology
The Business Facilities 2024 rankings are conducted by the editorial staff. Below is a list of sources used in the process of compiling the state, metro, and global rankings. The most current data and information from each source has been used in the evaluation of the relevant category(ies). In addition to the resources listed here, evaluations included data from resources readily available from economic development organizations, government databases, and related entities.
Advanced Medical Technology AssociationAerospace Industries AssociationAirports Council InternationalAlliance for Automotive InnovationAmerican Clean Power AssociationAvison YoungBroadbandNowCanadian Renewable Energy AssociationCBREClimate CentralCompTIAContainer Port Performance Index (CPPI)Council for Community and Economic Research (C2ER)Cushman & WakefieldCyberSeekDoD Cyber ExchangeEnvironmental Defense FundFCC National Broadband MapForbes AdvisorFORTUNEGlobal Business AllianceGlobal Financial Centres IndexHeadwater EconomicsISP ReportsJLLLightcastMedia Services, a Cast & Crew Co.Milken InstituteNational Conference of State LegislaturesOrganisation for Economic Co-operation and Development (OECD)PropTechOSRealtor.comRedfinSemiconductor Industry AssociationSolar Energy Industries AssociationStanford University, AI Index 2024 Annual ReportStartup GenomeStatistaStatistical Review of World EnergyStatistics Canada, agency of the Government of CanadaTax FoundationTECononomy/BIO ReportThe Global Financial Centres Index 35The World BankU.S. Bureau of Economic AnalysisU.S. Bureau of Labor StatisticsU.S. Census BureauU.S. Department of AgricultureU.S. Department of EnergyU.S. Energy Information AdministrationU.S. Environmental Protection AgencyU.S. Department of TransportationU.S. International Trade AdministrationWood MackenzieWrapbookYardi
Source link : http://www.bing.com/news/apiclick.aspx?ref=FexRss&aid=&tid=66b684ce46a344dd9a1097705c77f2e5&url=https%3A%2F%2Fbusinessfacilities.com%2F20th-annual-rankings-report-2024-state-rankings%2F&c=4560080014654807907&mkt=en-us
Author :
Publish date : 2024-08-08 07:23:00
Copyright for syndicated content belongs to the linked Source.