

monsitj
Performance and net asset value Quarterly return† 6.25% NET ASSET VALUE PER UNIT AT 30 SEPTEMBER 2024† $1.1621 † after all ongoing and performance fees. High watermark at 30 September is $1.1628/unit
Click to enlarge
The Dynasty Trust NAV increased by 6.25% during a volatile quarter; variable currency moves by the A$ (up versus US$, lower versus €) reduced NAV by 0.87% and were notably strong in September. The strong return emanated from our larger positions: Odet (OTCPK:FCODF) and Catapult International (OTCPK:CAZGF) both rose over 20% (21% and 29% respectively) and each contributed 1% or more to performance. Our best gainer was Virtu Financial (VIRT), up 36% + dividend. Four other securities, which reported strong results in the period, added 40bp or more to the portfolio in the quarter: Harworth Group PLC, Robertet (OTCPK:RBTEF), Magellan Financial (OTCPK:MGLLF), and E-L Financial (OTCPK:ELFIF). The two largest detractors were Occidental Petroleum (OXY, oil price weakness) and TFF Group (OTCPK:FRFTF, global spirit weakness, impacting demand for barrels).
We acquired two new holdings in the quarter – Avolta (OTCPK:DUFRY), a Swiss-based airport retailer across the spectrum of duty free, food service and convenience – discussed briefly in QR#6 as was the other new holding, Sportrader, a data provider for sports gaming companies. We reduced our holding of Catapult International with the shares having reached our valuation, gaining 180% since acquisition. We still retain a significant position given the tailwinds for the industry and the company’s positioning. We fully divested FRP Holdings (FRPH) where we have greater question marks over future valuations of the commercial portfolio.
Dynasty Trust’s top twenty positions as at 30 September 2024 as a percentage of net asset value are:
Click to enlarge
At quarter end, we retain around a 4.5% cash weighting. After recent wider market gains, we are more cautious on the equity outlook given the re-rating of $1 of unchanged near-term US earnings expectations by 19% over the course of the 2024 year – despite minimal change in long-term bond rates. We are conscious that the price demanded of some of the very best global businesses have risen even more sharply, requiring a longer, overly optimistic high-growth runway to justify purchase.
International Man of Mystery
Two of our larger portfolio exposures – Bollore and D’Ieteren – made significant announcements in September. They are moves designed to take each grouping into a new structure (Bollore) or set the group for the next generation (D’Ieteren). Unlike yen carry trades and what Jensen Huang had for lunch, these changes have far more than an ephemeral impact. It is incumbent upon us to analyse and report.
But starting on page 9 is a detailed analysis we have been seeking to write for some time on a mysterious Dutch/Caribbean treasure trove, which many have walked away from – HAL Trust.
The HAL analysis serves a wider purpose other than simply assessing a company at which most investors would not take a second look. We have followed this business for well over five years – a period during which share price performance has been barren at best.
The entity is the most secretive of any of the 37 securities we currently hold. HAL Trust (HAL, HAL.AS)- is a Bermudan Trust whose sole asset is shares in a Dutch (formerly Curaçao) company, HAL Holding NV which was operated out of Monaco but from April this year, moved to be operated from “hometown” Rotterdam. Like most major Dutch corporates, HAL Holding has a supervisory (non-executive) board and a small two-person Executive Board (CEO, CFO).
HAL is ~70% controlled by “International men (and women) of mystery” – the van der Vorm family – who in their third generation hold two of the five Supervisory Board seats and appear to us as becoming yet more opaque.
By looking at HAL’s history since Micky Arison dumped US$625million in its lap in November 1988 to acquire Holland America Line, and the family opted to retain the funds and invest them, we can learn so much about the pressures and benefits of other publicly listed family-controlled entities. Why some prosper and nurture public stockholders, with others for illogical reasons staying listed but not embracing public capital. There are the pressures of expectation – wealth and IQ are often confused – but also with the cycles any investor will endure. HAL went through a stellar period, where each major investment and business decision paid off, and net NAV compounded at 16.5% per annum plus a 4% dividend pa for a thirteen-year period.
If HAL wasn’t already popular amongst retail investors in the Netherlands by allowing you to invest directly alongside one of the country’s very richest families in its key wealth creating vehicle, this sustained period of strong returns provided further endearment. Even after HAL NAV had peaked, HAL’s share price at end 2016 (€180) traded at a 10% premium to NAV (€162.50).
The returns of thirteen-year period from 2002 to 2015 abruptly slowed, with some very poor individual investment decisions; however, the ballast from past periods – for many wealthy families wealth retention rather than return is the key driver – means that opportunity cost rather than permanent diminution in value is the issue.
In our view, investors seem to have written off HAL Trust because of these erroneous decisions. The key feature of this Quarterly Report is a detailed breakdown of why we believe HAL to now be significantly undervalued, where investors are potentially missing more rapid pace of NAV growth at HAL, but also how this value may seep into the publicly quoted shares of HAL Trust.
Bolloré: opening the road to a “roll-up”: Odet the probable 2025 target
We sincerely apologise for once again writing about the Bolloré galaxy. The announcements in the past quarter were unexpected and of genuine meaning. Why? The Bolloré galaxy is undertaking its first mop-up/squeeze out transactions in the Rivaud Group of companies1 since the exercise on Plantations Des Terre Rouges (‘PTR’) in 2013. These are highly relevant since they involve privatising the three key holding companies – Compagnie du Cambodge (“Cambodge” mkt cap €5.3billion), Financiere Moncey (“Moncey”; cap €2.2billion) and Société Industrielle et Financière Artois (cap €2.5billion) and the two smaller intermediate companies “Var et Gard” and “Tramways de Rouen” via respective mergers with Cambodge and Moncey. Events in the Bolloré galaxy seem to be progressing more rapidly than expected.
PTR is the largest shareholder in Cambodge which in turn is the largest owner of Moncey (with PTR the second-largest owners); Moncey is the largest owner of Artois.

Bolloré aficionados will, of course, find multiple fascinations and conspiracy theories, but there are three genuine wider ramifications with these moves:
All three of the larger companies have direct and indirect shareholdings in the listed holding company, Compagnie de L’Odet (Odet); as a consequence, we can drive each company down to an implied value being offered by Bolloré per Odet share; The implied value per Odet share is relevant because under French takeover law, with Vincent Bolloré’s interests having effective control of 93.05% of Odet2, they can launch a takeover offer, followed by a “squeeze out” because less than 10% of the shares are in “minority” hands. Indeed, the squeeze out laws are being used to privatise Cambodge, Moncey and Artois. However, the squeeze out price has to be approved by France’s AMF3 with an independent report4 since the shares are effectively being expropriated5. A successful completion of these deals will leave the control companies above Odet as effective joint ventures between the individual holding companies (Sofibol, Financière V, Onium Bolloré) – which are all ungeared – and Bolloré. To open the way to “rolling-up” the holding companies (see chart below, where all the companies on the right-hand side just become “Bolloré”) only necessitates the privatisation of Odet.
The need for the cascading control structure required in the early 1980s to grow, raise capital but retain control is now much diminished. The Bolloré family can retain control of the main group assets without as many levels of the pyramid having built up significant equity in the group. The brilliant structure of “Breton Pulley’s” erected by Antoine Bernheim will increasingly act as a discount mechanism to a relatively transparent group of underlying assets – made less opaque by the break-up of Bolloré’s 30% owned Vivendi into four composite fungible pieces. The analysis which follows suggests that over the next couple of years, there is a strong possibility of rolling up at least two levels of the pyramid, to bring out the value of the assets to the ultimate controllers – especially given the €6billion of cash within the group.
There does appear to be significant shareholder discontent with the take out offers on the Rivaud shares; given the residual shareholder base of long term committed and smart individuals, the quality and level of company argument to date is rather poor.

If Odet is privatised via a squeeze out, by Bolloré, then it could distribute its only effective only asset6 (1.993billion Bolloré shares) to its two shareholders – Sofibol with 56.4% and Bolloré with 43.6%; Since Bolloré would then acquire 875million shares of itself (43.6% of 1980million) which would be cancelled7, Bolloré’s share capital would reduce substantially from a full 2,852million shares to ~1,977 million (cancelling a small amount of existing Treasury stock). Sofibol would own 1,118million Bolloré shares.
We can do the same exercise for Sofibol to distribute ITS Bolloré shares (its only asset of note), which would give Financière V 571mn shares (1,118million x 51.1%)and Bolloré 546m – to be cancelled.
This exercise can theoretically go further up the chain, but runs into a roadblock around Financière V. All the while, the “public” own an unchanged ~858million Bolloré shares, which becomes proportionately larger as Bolloré shares are cancelled as part of the roll-up. The roadblock arises since the proportional ownership of Vincent Bolloré (Bolloré Participations) falls as the pyramid is dismantled. At the Sofibol stage it is ~56.6%, falling to 40% at Financière V and 25% at Omnium Bolloré. If the pyramid was FULLY rolled up, then the family’s stake in Bolloré SE would only be 14.4% of the 1,003million shares which would remain on issue if that occurred.
mn shares
Hold Co name
HoldCo %
Hold Co
Bolloré %
Stock cancelled
public
Issued Capital
Family
Now
Odet
1993.0
858.5
2851.5
69.9%
1
Sofibol
56.1%
1118.1
43.9%
874.9
858.5
1976.6
56.6%
2
Financière V
51.1%
571.3
48.9%
546.7
858.5
1429.8
40.0%
3
Omnium Bolloré
50.3%
287.4
49.7%
284.0
858.5
1145.9
25.1%
4
Bolloré Participations
50.2%
144.3
49.8%
143.1
858.5
1002.8
14.4%
Click to enlarge
All our discussions with other Bolloré experts suggest that would never happen. We agree. The family are obsessive about control -why was the structure there in the first place? To retain proper control (50% + 1) would also require ongoing buybacks of Bolloré’s own shares which, as the share count is reduced in a roll-up, have much more meaning. Of course, it is a cementing of complete control by the family using Bolloré’s own funds; bluntly, what controlling entrepreneur hasn’t done that! Given we estimate Bolloré shares would be worth €15-16 each on a full roll-up- just on the current asset base – which would still have €4.8billion of cash under the assumption below – who would be complaining?
Our best guess is that the roll-up would go as far as “level 2” – Financière V (ironically the original vehicle) – accompanied by progressive buybacks of ~300million shares would accomplish the outcome. We believe the chance of Odet and Bolloré merging with shares are unlikely to eventuate; moreover, it is to the family’s advantage for the Bolloré share price to remain subdued for the time being.
So what’s the cost of an ODET squeeze out?
Many analysts, ourselves included, have a transparent see through value of Odet being upwards of €4,000 a share. Because the extinguishment of Odet would be through expropriation with an independent report, the outside expert will use indicators such as “share price” as “valuation” tools8, and MAY get some solace from the current round of privatisations of the Rivaud group, which, because the companies all have direct and indirect exposure to Odet, can be driven down to a value per Odet share.
The brilliance of Bolloré’s alternative offer of UMG shares for each company deliberately offers an arbitrage and takes the attention away from the implied values in the cash offers.
The table below is a simplified summary of the implied value of Odet contained within the €257million worth of Rivaud offers prior to the very minor adjustments required for the Var et Gard and Rouen mop-ups; we assume NO value for IER, the ticketing system (loss making) and apply NO discount for differing levels of holdings for Odet shares – direct versus indirect:
€million or per share
Artois
Moncey
Cambodge
Minority offer consideration
103million
90million
64million
Shares issued (pre stock split)
266,200
182,871
533,972†
Offer price (cash)(pre stock splits)
€9,300
€11,800
€9,300
Market Cap of company at offer
2,476
2,158
4,966
Value of non ODET share assets
1,496
640
1,193
Value of ODET shares
980
1,518
3,773
Actual number of ODET shares‡
446,215
904,190
2,053,939
Value per ODET share
€2,195
€1,679
€1,837
Click to enlarge
† adjusted for 4.6% holding within Plantation de Terre Rouges treasury loop
‡ assumes no debt in Sofibol, Financière V, Omnium Bolloré and proportional interest on Odet shares
Click to enlarge
In our opinion – we have no horse in this race, but the result is of major interest – the offer for Moncey, even allowing for four “levels” of exposure to Odet seems very low, whereas the Artois offer, which was the highest premium above undisturbed price – seems more “realistic” judged against Odet, though well below full value of that company.
If we reverse engineer the highest price, within Artois, of €2,200per Odet share, we arrive at a price of €7.35 per Bolloré share.
€million (updated for 30 June 24 balance sheet)
Eliminate
SCL†
Don’t eliminate
Comments
“value” / ODET share
€2,200
€2,200
Issued ODET shares
5.649m
6.586m
MARKET CAP
12,428
14,489
Vivendi shares (€10.30)
62
62
6.05million
UMG shares (€23)
138
138
6.2million
Debt
(360)
(360)
Via deconsolidation
IMPLIED VALUE BOLLORÉ SHARES
12,888
14,649
Bolloré shares
1709m
1993m
IMPLIED VALUE/BOL share
€7.37
€7.35
27% premium to current price
Click to enlarge
†self-control loop between Odet and Bolloré
Click to enlarge
As part of Bolloré’s buy-back tender offer at €5.75/share in mid-2023, the Independent Expert furnished a valuation range of €7.93 -€9.33/share9, before applying a large discount based on a cohort group of listed holding companies, of whom only one – Exor – had a track record of NAV growth anywhere near comparable to Bolloré. Given that a squeeze out is “expropriation” these discounts would not be applicable, and the analysis subject to far greater scrutiny.
Hence, in our view, there is a chance that Bolloré may have to raise their offers for the Rivaud companies. Moreover, we don’t see any application of these implied Odet prices in an ultimate take out, which whilst not full value, would have to be closer to €3,000 per Odet share being ~€10/Bolloré share – a cost of €1.44billion.
With only ~480,000 Odet shares to squeeze out, each incremental €100 per share costing ~€48million and a cash pool of €6billion, it is hardly beyond the scope of Bolloré to not risk legal recourse from a highly informed 7% minority group, when the day comes, which we now have enhanced expectations of being in 2025. Any which way you explore the tactics and strategy, these valuations are significant premia to prevailing share prices, with value accretive moves to come.
D’Ieteren: the seventh generation divides opinion10
The 60% “D’Ieteren family” control (63.6% by votes) of the listed company (DIE.BR) is split between the descendants of the fifth generation Pierre D’Ieteren: grandson Nicolas with 32.9% (17.7million shares) and Nicolas’ 80 year old aunt Catheline Périer D’Ieteren (a renowned art historian) whose son Olivier Périer manages SPDG (s.a.de Participation et de Gestion) with 27.3% (14.7million shares). The Périers have been diversifying SPDG for some time and have now reached a stage where they wish to reduce the shareholding in D’Ieteren which will be done – subject to shareholder approval – by a block sale of about 9million shares at €223.75/share leaving the remaining 5.7million shares (10.6%) to be reduced over five years.
To partly fund the €2billion investment by Nicolas’ vehicle, Nayarit, which will advance to 50.1% of D’Ieteren, the company are raiding every available piggy bank to pay a €74/share dividend to all shareholders, being ~€4billion. The piggy banks? €850million of parent company liquidity, new bank debt of €1billion into the parent, a ~€4.3billion dividend paid by the ~50% owned Belron (DIE.BR share €2.2billion), bring Belron’s debt up to €8.9billion.
There are two sides to this story: conservative and liberal.
The conservative group have certainly been ascendant since the announcement. DIE.BR shares have fallen 16% from €226 to €189.90 on the basis that Belgian retail investors are petrified by the new debt exposure which hasn’t been seen in the group, the gearing of the holding company, which is unusual when subsidiaries are also geared, and such quantums of debt in businesses which are “auto-related” albeit with a lot of “replacement”- Belron (vehicle glass replacement, D’Ieteren Auto – VW-based vehicle distribution, and 91% of Parts Holding Europe). Moreover, the vast majority of shareholders are subject to tax on the dividend of 30%. The conservative’s fear is that any slowing of European economies will work through increased gearing to significantly reduce the equity value of Belron and, to a lesser degree, the other businesses.
The liberal viewpoint has a more American slant, which has relevance not only through numerous US based funds as significant DIE.BR shareholders, but American owners (CD+R, Hellman & Friedman and BlackRock) holding an estimated 32% of Belron.
This viewpoint acknowledges:
the strength of the businesses, the belief – expressed in the latest half-yearly report – that Belron’s US profits will start to re- accelerate as a result of higher auto insurance rates in the US (the most sluggish of Belron’s regions in the latest results); the pressure from the private equity owners to facilitate a Belron IPO; the likely location of the IPO being in the US being used to refinance Belron as well as facilitate reductions/exist of existing holders; and the fact any IPO raising will be constrained by the lower equity value of Belron given higher debt and lower rating from gearing.
We can see both sides of the equation, but are happy holders at present. At the reduced price of €189.90 (implied €115.90XD), using a similar tabulation and values to the D’Ieteren/Belron piece in QR#5 (March 2024, page 11) we believe on an ex-dividend basis(ignoring tax):
we are gaining exposure to Belron at a P/E below 12x; we are gaining exposure at EV/Operating profit multiple again below 12x; and Adding back the dividends and capital returns in 2022, 2023 plus the proposed dividend -€6.25billion in total – to implied enterprise value, gives an equivalent of -€21.7billion. This is 3% above the Clayton, Dubilier and Rice, Hellman & Friedman, GSIC and BlackRock private equity transaction of December 2021 of -€21billion (€17.2billion equity; -€3.8billion debt) since when operating profit is up over 56%.
€millions
Equity value
estimate
Equity capitalisation DIE.BR
10,338
54.437mn x of €189.90
Dividend paid
(4,208)
EX dividend market capitalisation
6,310
Parent company debt
1,041
Cash 787, Belron dividend 2,200, dividend paid (4,028)
Enterprise value
7,351
(‘A’)
Other subsidiaries:
TVH (40%)
1,170
Purchase price late 2021
PHE
1,019
cf purchase price 571m in August 2022 (gearing)
Moleskine
250
Equity and loan exposure
D’Ieteren Auto
1,904
12.5x P/E
Est. holding company costs
(310)
After tax estimate of €24million at 13x
Property
42
Total subsidiaries/Holdco costs
4,075
= €74.86/issued share (54.7million) (‘B’)
IMPLIED VALUE BELRON STAKE
3,276
for 50.3% (A-B)
IMPLIED 100% BELRON EQUITY
6,513
(‘C’)
Belron Operating profit (est 2025)
1,310
Finance costs
(555)
New Belron debt €8,930million
PRE TAX PROFIT
755
NET PROFIT
550
(‘D’)
Effective P/E
11.8x
(‘C’)/(‘D’)
Implied EV Belron
15,440
Implied EV/Operating profit
11.8x
Click to enlarge
Aside from the cashflow qualities of Belron, which we expounded in QR#5 in March 2024, the modest rating, even allowing for debt, leaves us happy to take on the higher risk and remain holders.
HAL Trust: cracking the enigma to solve the mystery and unwrap the riddle11
“I know I’ve made some very poor decisions recently, but I can give you my complete assurance that my work will be back to normal. I’ve still got the greatest enthusiasm and confidence in the mission”. – HAL 9000 as Dave commences disconnection “2001: A Space Odyssey” (Kubrick 1968)
If I said to you, we are invested in a company where:
NAV/share at 30 June 2024 is below the level of 31 December 2015 17% of the shares are owned by a probable (at least part) seller; There is only a further 15% free-float; our company spent €700m cashing out a private equity firm at four – six times the PE firm’s investment in ProGamers made only three years before, but three years later, HAL handed our equity to lenders at zero; our company acquired 31.5% of ProDrive Technologies in February 2022 for €211million; by end December 2022 it had impaired the stake by €130million(>60%) before buying out one of the co-founders; management make no public presentations – ever; and have further trimmed the level of external disclosure using IFRS accounting standards only, removing some useful pro forma management accounts
you would reasonably wonder if I had taken a nasty blow to the head. We hope the following pages will explain why we feel we have no neural impairment.
HAL Trust is ~68% controlled by two entities connected to various members of the van der Vorm family notionally based in Rotterdam; a further 17% is owned by the descendants of Hans Melchers, a wealthy Dutch investor who passed away in November 2023. Collectively, the van der Vorm family are reputedly amongst the wealthiest in the Netherlands, but have a myriad of historic structures in low tax Caribbean jurisdictions. HAL is a company which does not court publicity. There are no existing investment presentations, and the only information available to shareholders is an interim report, two small quarterly updates and a statutory annual report plus any other required continuous regulatory disclosure. Contact with the investment community is minimal, and usually only with trusted counterparties. However, it is a long-term favourite amongst Dutch retail investors.
The basic thesis: cheap and ignored, transition to operating earnings, exposure to alternate energy
HAL is much more a conglomerate than a traditional European holding company in the tradition of family-controlled investment entities. HAL has high levels of operating income from majority owned businesses which facilitates significant cash flow generation, as well as ownership of a ~€4.3billion quoted equity portfolio, some highly profitable real estate exposure plus bonds and other net liquidity. At €118.40, the shares trade at a 26% discount to stated NAV at 30 June 2024, which substantially understates the real value of the entity, which, we believe, is over €200/share.
HAL is priced in a consistent manner with European holding companies at ~40% discount to “assessed” NAV; to break this nexus, requires the clearance of an “impediment”. For example, Exor (EXO.AS) continues to trade at ~ 44% discount to NAV despite its astonishing performance of 18.6% per annum12 since the reorganisation in March 2009; this reflects more conservative investor fears over the total automotive exposures and the specific 44% net portfolio exposure to Ferrari. HAL’s situation is different in that the world’s largest non-Chinese dredging company, Boskalis makes up 47% of asset value within our assessed NAV, this maritime behemoth is wholly owned with HAL having full access to cash flow.
HAL’s inability to grow NAV over a lengthy period of time, allied to embarrassing slip-ups such as those noted above, which has vastly diminished its share price rating versus NAV, stalled since the mid-2000s.
There are signs this period of difficulty is concluding. The acquisition of the 54% of Boskalis then in public hands in 2022 was hard-nosed and has proved to have been a bargain, valuing the company at around half what it is worth today. The creation of ~€4bn of value in this deal pays for a lot of ProGamers, but more meaningfully, appears to have given the company the wherewithal to pursue other “maritime”-type assets in areas it knows well, unlike Gen-Z gaming enthusiasts stuck indoors during COVID. There is a strong exposure to servicing alternate energy via Vopak, parts of Boskalis, parts of SBMO plus Anthony Veder Group – all up (with a slight finger in the air) about €4billion worth of exposure.
Valuing and assessing HAL is a bit of a chore, because of the volume of businesses owned and the need to avoid double-counting. But the company’s reports have been templated for some years so that once you become familiar with the format, the analysis is not too difficult, despite the company’s predilection for disclosing – but hiding – disclosures such as write-offs.
HAL’s structure is not that complex, and we broadly use the stated template of four areas – with some minor adjustments – to assess and value HAL, including post 30 June 2024 known changes:
Assessed value of HAL Trust as at 30 September 2024 on a deconsolidated basis13
€million
Per HAL
share
Comments
Listed securities
4,661
€51.58
VPK.AS, SFL.MI, SBMO.AS, TE.PA,
WAF.DE + undisclosed
Book value of operating subsidiaries
3,225
35.69
as at 31 December 23 annual report disclosure adjusted by East 72 (see discussion)
Coolblue (56.4%)
320
€3.54
Includes increased investment
Koppert pref shares
140
€1.55
US real estate
206
€2.28
Includes recent Seattle sale
Netherlands real estate
84
€0.93
Boskalis (enterprise basis)
8,750
€96.82
includes Smit-Lamnalco deal (not settled)
TOTAL VALUE
17,386
€192.39
Debt
(1,926)
(€21.31)
Deconsolidates Vopak and Safilo
Cash (excluding cash held in Boskalis)
1,745
€19.31
Fixed interest
1,415
€15.66
NET CASH
1,234
€13.65
Excludes €680million in Boskalis
TOTAL
18,620
€206.04
90.37million shares
Click to enlarge
HAL has an equity market capitalisation of €10.7billion, a 42.5%, discount to our valuation(50% adjusted for cash); however, our valuation is 29% higher than the stated valuation in the 30 June 2024 interim report.
The following sections look at the backstory of HAL Trust, discuss their strategies, assess whether there are catalysts to close the discount to value gap, before separately assessing the listed portfolio, unlisted companies, real estate and Boskalis to verify our valuation assessment.
Click to enlarge Backstory14
“van der Vorm did not like to be on a pedestal, he preferred to remain Mr. X. After his death all personal archives had to be destroyed…his hiers saw to that. ” (translated from Dutch) -“Willem van der Vorm: a figurehead illuminated” 2007 Thesis by Elly de Leeuw Hilberts (available online)
Tracing the history of the company and its family controllers back to 1873 sounds like pedantic overkill; believe me, it’s not. The current administration shares common traits with the “founding patriarch” Willem van der Vorm: an overwhelming desire for privacy and secrecy15 yet social generosity16.
Open every HAL Trust annual report and on the inside cover “the history of HAL dates back to April 18, 1873, when the Nederlandsch-Amerikaansche Stoomvaart-Maatschappij (N.A.S.M.) was founded in Rotterdam, the Netherlands. NASM, of course, became the “Holland-Amerika Lijn” with its original voyages from Rotterdam to New York.
The van der Vorm involvement in maritime and ancillary activities doesn’t start with HAL, although coincidentally, Willem van der Vorm was also born in 1873 in Rotterdam. After qualifying as an accountant and operating in the port business, van der Vorm joined American Petroleum Company, which in turn formed SSM (a shipping and coal trading company) in 1896. APC sold SSM in 1905 – with van der Vorm appointed as a Director and becoming a co-owner and growing its fleet to 8 ships by 1914.
Van der Vorm gradually expanded SSM’s range of interests to rope making, gas, photography and began to merge as a key businessman in Rotterdam; in turn, he became a key leader in the salvation of Robaver, a bank holding company in the early 1920s – a position he maintained for twenty years.
The connection between van der Vorm and HAL begins in 1933, as head of a syndicate to rescue HAL, after being impacted by prevailing depression conditions. HAL operated under a supervisory committee for five years, and in a typical initiative of the times, build a significant new vessel “Nieuw Amsterdam” – with Government assistance – launched in 1938.
In May 1940, the linkage to Curaçao, the semi-autonomous Dutch island in the Caribbean, came about after the bombing of Rotterdam and the loss of three vessels; this feature persisted with HAL Holding NV (see below) having its place of “effective management” on the island until April 2024.
HAL Holding was listed on the Amsterdam Stock Exchange in 1954 to include the shipping line and other investment activities; the entity was restructured in 1977 with an effective scrip swap to HAL Trust, which now holds all the shares of HAL Holding NV. The trust is incorporated in Bermuda, which with assorted clauses of the trust deed leave little leeway for minority shareholders.
Willem van de Vorm died in 1957, with no successors, having never married.
Effective succession passed to his nephew William Henry van der Vorm, through whose lineage the current family management representation, resides through his grandson, 66 year old Chair Martijn van der Vorm. However, the current Chair’s father, Nico, is responsible for the most seminal move of the company: the US$625million (tax-free) sale, in November 1988, of Holland America Line to Carnival Cruise Lines.
This transaction is the basis of the current HAL, leaving the Trust with US$675million of equity at 31 December 1988, which as compounded at 9.2% net of any taxes over 35.5 years, on stated values.
Patient stalkers and consolidators
Stripping down the building of HAL Trust post divestment of Holland America Line shows some common themes:
A love of industry consolidation plays; A willingness to stalk, over extended time periods, to obtain what they truly want; A willingness to be a backstop financier (with debt or equity) for financially troubled businesses; Parsimony on takeovers, occasionally to their long-term detriments; and Extreme privacy.
The consolidation/roll-up is evident throughout the existing portfolio. Timber and Building Supplies, Broadview, Auxilium and arguably Boskalis. What worked spectacularly in eyewear retailing and hearing aids hasn’t really done so elsewhere – yet. But there are signs.
HAL made gains of €4billion on two end game transactions in “care” retailing over periods of 15 and 25 years respectively:
Building from 2001, with virtually no mention in annual reports before 2008, HAL built AudioNova from scratch via acquisitions of store groups across Europe until selling the business in September 2016 to Sonova Holding (OTCPK:SONVF), the Swiss owners of Sennheiser and Advanced Bionics for €830million and a gain of €490million; Two brilliantly executed optical care roll-ups starting in 1996 purchasing a 78% interest in Pearle Vision’s stores in the Netherlands from the UK’s Grand Metropolitan subsidiary, Pillsbury as Cole National, a US listed company acquired the domestic business and retained 22% of the Netherlands enterprise. HAL continued to add to Pearl Europe through acquisition of smaller groups across the continent, as well as acquiring a 19% stake in Cole National. When Cole was acquired by Luxottica in 2004, this stake gave HAL the leverage to acquire the 21% residual minority of Pearl Europe from the Italians. A takeover in 2004 of GrandVision, the French eyewear retailer for €600million in the publicly listed group after building its stake from 6% to 32% and teaming up with its management to thwart the counter-bidding parting – coincidentally the private equity group PAI who control Mercolin, the key competitor to HAL controlled Safilo in eyewear manufacture; The July 2010 merger of Pearle Europe and GrandVision The IPO of the enlarged GrandVision in early 2015 at an effective equity value of €5billion, with HAL taking ~20% off the table to the public; and The eventual acquisition of Grand Vision, after all clearances, in July 2021 by Luxottica for of HAL’s stake for €5.5billion and a gain of €3.5billion.
HAL supported Boskalis for many years, buying its first 20% holding in 1989, gradually increasing its stake to 31% by December 2003. In 2009, HAL took a placement to facilitate the acquisition of SMIT International, diversifying Boskalis activities. HAL slowly crawled up the Boskalis register, acquiring shares almost annually, crossing the 40% mark in 2018, becoming more aggressive in 2019 and 2020 acquiring over 5% of the company. From its position of 46.2% in March 2022, HAL launched its offer of €32 a share, begrudgingly increasing it to €33 in August 2022. As we show in the discussion of Boskalis, the offer was very well-timed before revenues and profits increased sharply.
Other public takeovers have been heavily contested for small amounts of money. As we see with Westag (part of Broadview) a minor increase in the takeover offer would probably have secured 100% of the capital, but HAL are stuck with 83% of the shares, with Westag sat on €35million of cash. Likewise, HAL are stuck with 94% of TABS Holland in the building material sector after a bid in 2019, that in our opinion, was very stingy – the more so when earnings exploded two years later pricing the bid just above 2x 2021 EBITDA.
Are there any catalysts or end games to close the discount to NAV? Do you need one?
Other than the moribund NAV growth, a key reason for the large NAV discount is that the secrecy and lack of HAL’s own public discourse about the company extends particularly to sensitive subjects such as succession. The wider world has no idea who the van der Vorm family successor is, or even if there is one – the patriarch, Martijn van der Vorm is 66 years old, so it’s a reasonable question.
We could run a whole capital markets academic course just on HAL Trust and potential capital management initiatives which would enhance shareholder value. Sales of some of the moribund unlisted businesses to buy back shares. Using some of the cash pile for a buyback would potentially assist. A further change of dividend policy from the current cash dividend based on a 2.5% yield on the December share price. But a more consistent growth in NAV is clearly the best starting point, since we know that even if large discounts remain, that provides the return to investors (see EXOR). Our contention is that this NAV growth is in the throes of recommencement.
Given this is a Bermuda Trust structure, there is no real avenue for activist shareholders, other than to be noisy; there’s nothing they can enforce. Accelerated catalysts need to be “friendly” The most obvious accelerated catalyst touches on the secrecy issue and the largest non van der Vorm shareholders, the Melchers family, who have 17% of the shares.
The shareholding was established by Hans Melchers, who died aged 85 in November 2023. Melchers built up a chemical company, Melchemie17, which he sold in 2002 to Hüttenes-Albertus. Melchers used part of the proceeds to invest in HAL in a meaningful way around that time, and would have derived significant benefit from the rapid growth of NAV from 2002 onwards.
The investment in HAL – a very discreet public entity, where because of the Bermudan home base, the level of disclosure on shareholdings is far less, was very desirable. Mr. Melchers daughter, Claudia, then 37, was kidnapped in September 2005 by three men, but released two days later18. Ms Melchers is now 55 and runs a catering business. The question of whether her advisors suggest diversification of this €1.8billion stock holding – and such advice if given is acted upon – is a key issue for all HAL shareholders.
HAL clearly has the financial means to facilitate a share buy-back to assist Ms. Melchers19 but would probably have to “pro rata” such an exercise with other non-van der Vorm holders. It’s why the exercise within the D’Ieteren family (see earlier piece) is not totally irrelevant.
The sale of major shareholdings or businesses seems unlikely in the near term – most are priced slightly cheaply – unless a strategic buyer arrived. Could an enterprising private equity firm (Blackstone, KKR) acquire the whole of HAL on an agreed basis, at an equilibrium price for the company suiting both buyer and seller, say NAV of €160?? None of us have any real clue as to the emotional ties to parts or all of HAL except they won’t be zero.
We view HAL as having no catalyst priced into the shares, so don’t really worry about letting our imagination run wild on that front. Anything that hints of capital management -Vopak and SBMO have had buybacks this year and Vopak’s overall capital management is really attractive – should be a positive in driving down the discount.
Based on our numbers, HAL “parent” – estimating public company dividend payments added to private earnings – will have €650-€700mn a year after capex but before asset sales to allocate to dividends (around €270mn per annum on current policy) and other capital management, alongside its €1.2billion of net liquids. Real flexibility if HAL chooses to use it.
HAL TRUST: 22 YEAR COMPANY STATED NAV/SHARE PROGRESSION
shares (mn)
NAV (€)
per share
unlisted uplift
US RE
uplift
NAV TOTAL
per share
Dividend (XD following May)
31-Dec-02
63.674
1,532
€ 24.06
€ 1,532
€ 24.06
€ 1.25 †
31-Dec-03
63.682
1,885
€ 29.60
415
€ 2,300
€ 36.12
€ 1.45 †
31-Dec-04
63.674
2,000
€ 31.41
612
€ 2,612
€ 41.02
€ 1.80 †
30-Jun-05
63.687
2,280
€ 35.80
662
€ 2,942
€ 46.19
31-Dec-05
63.673
2,864
€ 44.98
652
€ 3,516
€ 55.22
€ 3.00 †
30-Jun-06
63.684
2,939
€ 46.15
652
€ 3,591
€ 56.39
31-Dec-06
63.490
3,591
€ 56.56
888
€ 4,479
€ 70.55
€ 3.15 †
30-Jun-07
63.508
3,914
€ 61.63
888
€ 4,802
€ 75.61
31-Dec-07
63.506
4,354
€ 68.56
1287
€ 5,641
€ 88.83
€ 3.25 †
30-Jun-08
63.527
4,236
€ 66.68
1287
€ 5,523
€ 86.94
31-Dec-08
63.541
3,341
€ 52.58
1174
€ 4,515
€ 71.06
€ 2.00 †
30-Jun-09
63.563
3,611
€ 56.81
1174
€ 4,785
€ 75.28
31-Dec-09
63.569
4,713
€ 74.14
761
€ 5,474
€ 86.11
€ 2.85 ‡
30-Jun-10
63.630
5,189
€ 81.55
761
€ 5,950
€ 93.51
31-Dec-10
65.388
5,879
€ 89.91
863
€ 6,742
€ 103.11
€ 3.75 ‡
30-Jun-11
67.280
5,776
€ 85.85
863
€ 6,639
€ 98.68
31-Dec-11
67.275
5,976
€ 88.83
614
€ 6,590
€ 97.96
€ 3.40 ‡
30-Jun-12
69.381
6,587
€ 94.94
614
€ 7,201
€ 103.79
31-Dec-12
69.386
7,255
€ 104.56
621
€ 7,876
€ 113.51
€ 3.90 ‡
30-Jun-13
71.553
6,917
€ 96.67
621
€ 7,538
€ 105.35
31-Dec-13
71.557
7,326
€ 102.38
703
€ 8,029
€ 112.20
€ 4.10 ‡
30-Jun-14
74.088
7,148
€ 96.48
703
€ 7,851
€ 105.97
31-Dec-14
74.033
7,678
€ 103.71
4311
€ 11,989
€ 161.94
€ 5.05 ‡
30-Jun-15
76.266
12,635
€ 165.67
159
€ 12,794
€ 167.75
31-Dec-15
76.273
13,180
€ 172.80
159
€ 13,339
€ 174.88
€ 6.50 ‡
30-Jun-16
78.500
12,348
€ 157.30
159
€ 12,507
€ 159.33
31-Dec-16
78.505
12,754
€ 162.46
228
€ 12,982
€ 165.36
€ 7.10 ∆
30-Jun-17
80.041
12,636
€ 157.87
228
€ 12,864
€ 160.72
31-Dec-17
80.040
12,122
€ 151.45
253
€ 12,375
€ 154.61
€ 6.20 ∆
30-Jun-18
81.691
11,556
€ 141.46
253
€ 11,809
€ 144.56
31-Dec-18
81.689
11,238
€ 137.57
297
€ 11,535
€ 141.21
€ 5.30 ∆
30-Jun-19
83.396
11,663
€ 139.85
297
€ 11,960
€ 143.41
31-Dec-19
83.398
13,694
€ 164.20
346
€ 14,040
€ 168.35
€ 5.80 ∆
30-Jun-20
83.363
12,692
€ 152.25
346
€ 13,038
€ 156.40
31-Dec-20
85.313
12,791
€ 149.93
360
€ 13,151
€ 154.15
€ 4.70 ∆
30-Jun-21
86.701
13,111
€ 151.22
691
110
€ 13,912
€ 160.46
31-Dec-21
86.701
13,111
€ 151.22
691
110
€ 13,912
€ 160.46
€ 5.70 ∆
30-Jun-22
88.599
12,811
€ 144.60
691
110
€ 13,612
€ 153.64
31-Dec-22
88.599
13,087
€ 147.71
358
122
€ 13,567
€ 153.13
€ 5.00 ∆
30-Jun-23
90.371
13,527
€ 149.68
€ 13,527
€ 149.68
31-Dec-23
90.371
13,563
€ 150.08
€ 13,563
€ 150.08
€ 2.85†
30-Jun-24
90.371
14,474
€ 160.16
€ 14,474
€ 160.16
Click to enlarge † cash dividend only ‡dividend paid only in shares ∆dividend paid 50% cash & 50% shares
Click to enlarge CORE LISTED PORTFOLIO
HAL’s listed portfolio exposures at 30 September 2024, up just over €300 million (€3.30/share) mark-to- market since 30 June 2024, are as follows:
€million or million
ticker
% held
shares held
price
value
Vopak
VPK.AS
50.3%
61.55
€ 41.68
€ 2,565
Technip Energies (OTCPK:THNPY)
TE.PA
16.2%
29.33
€ 21.62
€ 634
SBM Offshore (OTCPK:SBFFF)
SBMO.AS
22.9%
36.77
€ 16.39
€ 603
Safilo (OTCPK:SAFLF)
SFL.MI
49.8%
206.2
€ 1.10
€ 226
Siltronic (OTCPK:SSLLF)
WAF.DE
5.3%
1.59
€ 68.35
€ 109
Other undisclosed
€ 295
TOTAL
€ 4,432
Click to enlarge
Vopak is the key-listed exposure, not just because of size, but the transformation wrought on the company in the past three years by new management with capital discipline – something NOT evident at HAL who have one of six Supervisory Board representatives. Vopak is an extremely complex company given its geographical spread, end markets exposure, masses of joint ventures all allied to a fixed cost base. Consequently, analytical coverage is very specialist, and scanty – which is unlikely to change. (Bluntly, HAL should have privatised it two years ago.)
Without penning a 50-page tome we can only skim the surface for Vopak to bring out the key messages; similarly, the analysis below tries to bring out the key points of the other listed entities, where further information can be derived elsewhere.
Vopak: strategic reset has paid significant dividends
Vopak was created in 1999 from the merger of two long-standing Rotterdam-based storage, shipping and related service companies dating back to 161620. The basis of the merger between van Ommeren (34%) and Pakhoed (63%) to have global scale – was not easily executed given competition in the home market between the two businesses, plus Pakhoed’s acquisition of Univar, a chemical distribution business when the companies had initial discussions in 199621. The two companies had further talks and made a public announcement in March 1998, only for the merger to founder on European Commission demands of divestments in June 1998.
After widespread criticism, and the clear logic of the merger, the two companies resumed talks and consummated the transaction in November 1999. In the early period of the merged entity, there were strategic and cultural tensions, adding to the difficult business environment with global recession in the period. With supposed linkages between the businesses hard to find, in April 2002 Vopak cleared a pathway to focus on tank storage as the key business, divesting other assets and spinning off Univar, the chemical distribution entity.
With the share price depressed through the early stages of the combination, having owned a small stake in van Ommeren before the merger, HAL aggressively acquired shares; less than a year into the merger HAL held 29.1% of the company by August 2000 and 39% (but only 26% of voting rights) by September 2000. To facilitate the chemical split, €150million of new capital was required, 60% of which – by agreement – was provided by HAL at €20/share (€10 in current terms), giving the investor 46% of the common shares and 33% voting rights.
In April 2006, HAL sold 20% of its Univar shares for €41.60 a share and in July 2007, realised the remaining 8 million shares at €53.50/share into a takeover offer by CVC Capital Partners. The Univar exercise generated €675million of proceeds and €320million of capital gain.
Strategic reset from 2021
Vopak’s post-merger strategy of focusing on tank storage and tightly related activities has led them to become the largest global independent terminal storage provider with activities in 76 terminals across the globe encompassing 34.7million cubic feet (equivalent) of TOTAL storage capacity. The company classifies the activities as independent in that it does not produce any of the product being stored, unlike, for example, an integrated oil major.
The economics of terminal storage range from highly attractive annuity style income, to cyclically tricky operations; consequently, valuations of these companies can vary dramatically both as component parts and as a whole. At the most positive extreme, Vopak operates storage for LNG on a take-or-pay basis, which provides a fixed fee per period income stream over a long-term contract (10 years) irrespective of whether the tank capacity is utilised. Alternatively, other storage facilities are subject to significant changes over short periods, and exhibit airline-style economics: capacity and pricing are key to a return. An “empty tank” just attracts fixed costs of maintenance with no revenue.
The business has significant “moats” given that the terminals are waterside, and expensive to build, and are quasi monopolies; moreover, the moats are fortified by the need for strong customer relations, due to contract length, safety and quality. In many cases, the terminals are held in joint ventures and associated entities with co-investment; the most graphic example for Vopak is in Prince Rupert, Canada where Vopak is building a C$1.3billion 95million cubic metre (cbm) LPG export terminal in a joint venture (“REEF”) with the supplier, AltaGas to come on stream in 2026; it will sit adjacent to the existing Ridley Island terminal, a 95million cbm affair also jointly owned by Vopak/AltaGas opened in 2016. Vopak has 35 joint venture partners globally, and is the leading independent player in India and China.

REEF encompasses two key aspects of the “new” Vopak, which took shape after significant management change – new CEO and CFO – at the start of 2022:
A heavy focus on industrial and “new” gas, which now represents 50% of capital employed; and Discipline in respect of capital deployments away from cyclical chemicals terminals to the new environmentally attractive areas, with a significant improvement on Vopak’s measures of ROIC seen above (RHS of slide) Vopak has potentially much further to travel – long term
In our opinion, Vopak is still analysed as a very cyclical terminal company; as ROIC is sustained at higher levels, and the company utilises its NOW deep capital discipline to retire capital through buybacks and sustainable dividends, this should present a further chance for valuation uplift.
At 30 September 2024, Vopak has a market capitalisation of exactly €5billion (119.95m shares x €41.68) with consolidated net debt (excluding leases) of ~ €2.1billion, for an EV of €7.1billion. This calculation simply counts the equity value of some of the JV’s and associated companies or fully consolidates entities as required by IFRS despite significant minority interest; however, as with other infrastructure businesses, investors are increasingly focused on what lies underneath in respect of the true operating performance to Vopak of these entities (proportional basis). By its own admission, Vopak has still not fully completed the capacity to publicly show everything on a proportional basis, most notably future capital expenditure profiles.
On a proportional basis, net debt excluding leases is ~€2.7billion for an EV of €7.7billion. Current year 2024 guidance, updated at the June half, is for mid-point proportional EBITDA of €1.165million; this boils down to full year EBIT of ~€700million, leaving the shares on an EV/EBIT (proportional basis) of 11x.
As the company brings on stream more than €1billion of industrial and gas terminals and €1billion in new energies and sustainable feedstocks by 2030, with targeted returns on ROIC of 12% (currently >16%), we expect Vopak to grow profitability and retire further equity over the next two-three years. Analyst expectations are that the current year is a high return part of the cycle, with capacity utilisation at 92% and EBITDA margins close to 59%.
Vopak shares are up 225% in the past two years from low points in the mid €18.50 range as investors have grasped the early part of the management initiatives and are up ~40% in the current calendar year as operating conditions have continued to be strong.
We see scope for the shares to move ahead into the mid €50’s if conditions in the key markets hold together and the company is able to maintain financial discipline and bring projects to fruition on budget. The difficulty of analysing the company is reflected in flat-line forecasts over the next two years, which seem unlikely, either way. But the biggest impact of Vopak – we hope – is on HAL management….
Technip Energies: Unwanted cheap construction spin off
Technip (TE.PA) is a French-based engineering and technology company focused on downstream gas and liquids projects with a significant emphasis on the Middle East and Africa. Together with a more European focused technology business (renewables, furnaces and refineries). The company was spun off from Technip FMC to ensure its focus on more upstream business.
The TE.PA investment is very typical of HAL – writing its own ticket with the erstwhile parent company and feeding off its own expertise – Vopak, SBMO – elsewhere in the broad sector. At the time of the February 2021 spin, Technip FMC continued to hold 49.9% of TE.PA with an intent to sell down over time. As a consequence, the share price laboured over an extended period at between €10 – €13 (market capitalisation €1.8 – €2.35billion) leaving the shares extraordinarily cheap given the net cash balance of €2.5billion.
In September 2021, HAL acquired 9.9% (17.6million shares) of the company from TechnipFMC at €11.15/share; over the next three years, this stake has built to 29.2million shares or 16.2% at an estimated average price of around €13.
TE.PA trades at an EV/EBIT multiple on 2024 consensus forecasts of 3x (EV €1368m; EBIT€ €460million per mid-point guidance) and a mere 2.5x based on analysts forecasts for 2025. This is partly attributable to the obvious country and project risk profiles, but in our view, will likely improve if the company delivers with no major catastrophes, given the clear growth profile of “green” projects on its books.
Further capital management initiatives are also likely, with TE.PA having just completed an on-market buyback of 2.5% of its shares. Subject to price, we expect to see HAL build the stake even further, having re-categorised it to “listed minority” from “liquid investments during 2023.
SBM Offshore: more complexity but long-term income streams
SBMO has been around since 1965 and has developed into a global leader in the ownership, leasing and supply of FPSOs: floating, production, storage and offloading vessels in the offshore oil and gas industry. SBMO has an equity market value of €2.9billion and using its own “directional” accounting convention, net debt of US$7.1billion and has given guidance based on EBITDA which we estimate equates to EBIT of ~US$750million for the current year. (SBMO shares trade in €; accounts are in US$)
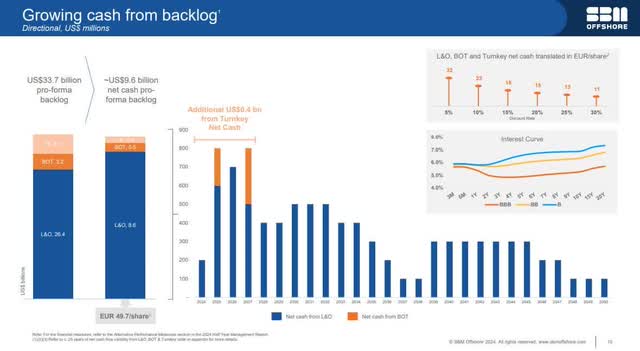
SBMO builds assets to sell, operate for a period and transfer ownership (BOT), or lease out and operate (L&O) in joint venture; the company currently has 17 operating assets with four more under construction, and illustrates the cash flow profile from each model as follows:

SBMO is the largest independent operator of these vessels, notably deepwater units, given that many of the planet’s FPSO’s are owned by the integrated oil companies. The company is starting to use its expertise in other areas, in particular floating renewables (offshore windfarms).
HAL’s position in SBMO came about in late 2012 when the company’s oil production platform, built for Talisman Energy to restart production of the Yme oilfield in the Norwegian North Sea blocks, previously abandoned by Statoil, was discovered to have cracks in cement grouting. The cracks raised concerns of the platform’s collapse in winter storms, and all personnel were evacuated. By agreement, the platform was decommissioned, removed and scrapped. In total, given previous construction overruns, SBM took charges of US$1billion.
To restore bank covenants, SBM placed 10% of its capital to HAL, who already had a 3.5% holding; HAL underwrote a rights issue at €10.07/share and emerged with 13.5% of SBM’s capital in early 2013. HAL build steadily until 2020, when it acquired a further 5% of the company over the course of that calendar year. We estimate HAL’s entry price to SBMO to be just below €11.

SBMO is an accounting nightmare thanks to IFRS approach to leases, joint ventures and associates. In particular, there are differences relating to:
the treatment of operating leases in “Directional” become finance leases in IFRS, inflating the profits under the turnkey “business”; and similar consolidation of ventures issues as in Vopak where IFRS forces ventures to be either fully consolidated or equity accounted rather than percentage of ownership.
SBMO shares have rebounded to their highest level since 2019 on strong “capacity utilisation” – 96% uptime in the latest half – and build to a record “pro forma Directional backlog” which is tabulated below at December year-end; given the operating model, the company has high visibility of its cash flows out to 2050 (see chart above) based on the lease terms for the FPSO, given the client pays for operating expenditure:
year
Backlog US$bn
year
Backlog US$bn
year
Backlog US$bn
year
Backlog US$bn
2012
14.5
2015
21.6
2018
14.8
2021
29.5
2013
21.0
2016
17.1
2019
20.7
2022
30.5
2014
22.1
2017
16.8
2020
21.6
2023
30.3
Click to enlarge
The backlog is a key alternative performance measure for SBMO and grows with contract length, new assets, and is transparently communicated with assumptions regarding operation of specific assets. Backlog at 30 June 2024 is a record $33.5bn.
SBMO also provide an undiscounted net cash backlog based on the same assumptions, net of overheads, tax and debt service, which might be equated to an embedded value within an insurance contract. At 30 June 2024, this equates to US$9.6billion or €49.70 per share.
We believe with further FPSO additions – most recently for Woodside Petroleum in Brazil and significant scope in the offshore windfarm space, we see significant scope for SBMO to be re-rated. Of the 17 operating FPSO’s and 4 under construction, 10 are deployed (o/w 3 under construction) in Brazil, 4 in Guyana (1 under construction) and 3 in Angola suggesting the hydrocarbon component of SBMO – despite obvious long-term threats – remains intact in the foreseeable future.
Safilo: One of the great business school lessons22- cleaned up for a deal. What deal? Hollowing out the industry: from LBO to the present
I’d be surprised if you’ve seen a sadder business story about a company that’s still alive, with revenues of over €1bn, but which has been systematically gunned down and pick-pocketed by 600lb gorillas. It’s a brilliant example of how the three biggest players in diversified luxury – LVMH, Kering and Richemont – cherish, guard and control their brands and use their financial firepower.
Safilo is largely irrelevant to HAL these days in the absence of the GrandVision business – it’s worth €2.50 per HAL share – and despite those folks who invested in the 2005 IPO and subscribed for the three subsequent rights issues having averaged down to a €5.46/share entry and so being down 80% on their money – HAL is actually slightly ahead, in nominal terms on its holding.
Despite its lack of financial relevance, It’s worth spending a few lines on Safilo – it’s an eye-opener to a wider world in luxury where the peripheral players struggle, shows how loyal HAL are to some of their investee companies, but more than anything shows how poor strategic positioning and lack of financial muscle is ruinous. Also, how HAL deals with Safilo from its present situation is very instructive on the wider thought processes within HAL. Can they cut a deal?
Safilo was founded in the nineteen century as Calalzo di Cadore, a lens and frame manufacturer. In 1934, Guglielmo Tabacchi acquires the business and uses it to found Safilo – Società Azionaria Fabbrica Italiana Lavorazione Occhiali. Over time, there is a strong focus on new designs and new material for frames, especially in the post-war period. Tabacchi died in 1974 and his two sons -Giuliano and Vittorio – took over the business, which they publicly listed in 1987, retaining a combined 60% stake. Growth had come from a significant series of brand licensing deals and the acquisition of a US business, Starline Optical.
In late 2001, Vittorio bought out Giuliano and undertook a leveraged buyout to privatise the company in December 2001; a year later, the LBO debt was refinanced via a €270million equity stake provided by CSFB Private Equity.
Three years on, in December 2005, Safilo was back on the Milan Bourse relisting via raising €313m through a listing of 64million shares at €4.90 and total market capitalisation of €1,388million (283mn shares); CSFB made exactly €100m profit on the sale of its 34% stake.
With the onset of the GFC, by the end of 2009 the company was in significant difficulty; operating profit had collapsed to €8.7million,and with net debt of ~€600million, Safilo was up for €54million in interest charges a year. At the eleventh hour, HAL made its move underwriting a 131:50 equity issue, purchasing bonds at 60% of par value and in early 2010 with 34% of Safilo plus acquiring its retail businesses in Spain, Australia and China.
In many ways, keeping Safilo alive was perpetuating the pain. The company never had the funds to purchase (or develop) other major brands, didn’t have a retail presence, and was perennially at risk of not being able to renew the contract manufacturing licences for luxury brands upon their expiry.
Bad things come in threes. In 2017, Safilo’s world started to fall apart in front of it. Neither it – nor HAL – did anything to respond.
Firstly, on 17 January 2017, the 600lb gorilla – Luxottica – you had been playing against in your home town for years23 bulked up even more with its merger with Essilor, the world’s largest manufacturer of ophthalmic lenses; the €24billionmarket value company, merged into another – driven by Luxottica’s controlling del Vecchio family; the €48billion merger creation, which due to regulatory scrutiny did not fully complete until March 2019. EL.PA is now valued at €97billion.
Secondly, a major blow, with Kering (Gucci, Saint Laurent, Bottega Veneta) having hatched an eyewear plan in 2014, brought it to real fruition in March 2017 when the company joined up with Richemont to contract manufacture its eyewear under licence with Richemont taking a 30% stake in the venture24 It brought all its brands in-house, including those manufactured by Safilo.
Thirdly, quietly planning, in January 2017, LVMH joined forces with another venerable Italian manufacturer Marcolin (revenues ~ €500million, so half Safilo’s size) to create a JV – Thélios25- to bring LVMH into the eyewear industry. Don’t go looking in the 2017 LVMH documents for it; in October 2017, LVMH acquired 10% of the private Marcolin.
The completion of the EssilorLuxottica transaction came just after Safilo had finished raising equity through a 3.4:1 rights issue at €0.704 a share – bringing in €150million. What was the point? In 2014, Safilo manufactured all of Kering’s brands under licence and from 2017 had none, albeit with a compensation payment. In December 2019, LVMH announced it would be bringing all of its brands into the Thélios JV from 2021 – notably Dior and Fendi – with a loss to Safilo sales of €200million.
Moreover, Thélios built the first new factory in 60 years in Longarone – opened in August 2018, and just 40 minutes drive from Agordo where Safilo were headquartered; in October 2023, Safilo sold its Longarone plant to LVMH.
In December 2021, Safilo raised a further €135million in equity via another rights issue at €0.98 with HAL contributing its share and by now holding 49% of Safilo – in the same month that LVMH really took the wraps off by moving to 100% of Thélios, acquiring the 49% for €158million, selling its 10% of Marcolin for €30million and ensuring eyewear was a key new vertical of the behemoth.
What now for Safilo?
The major strategic hurt for Safilo has realistically concluded – the major luxury houses now manufacture all of their eyewear brands in house so whilst there will be gains and losses of the non LVMH/Kering/Richemont brands, and some will hurt (as seen by the loss of Jimmy Choo) none will be as fundamental as the loss of the LVMH brands.
The current landscape of “high-end” eyewear manufacturing, a ~€20billion pa market can be assessed per the table below:
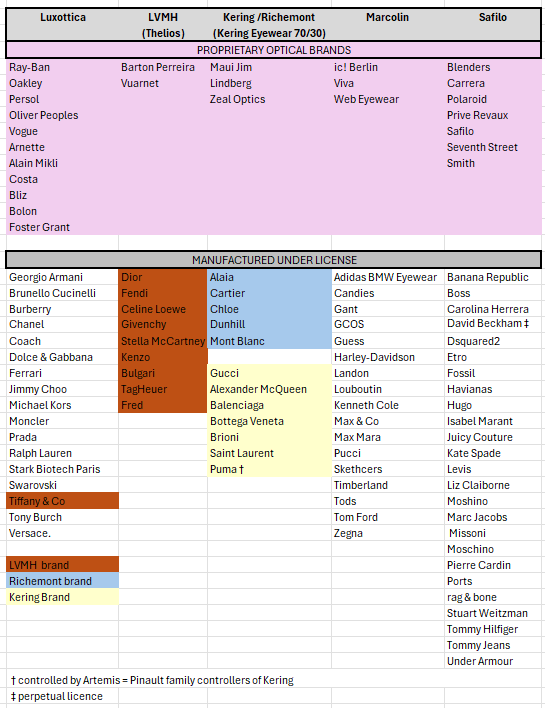

The obvious strategic industry play is to merge Marcolin and Safilo. Marcolin is 83% controlled by private equity firm PAI Partners, who have been involved since December 2019, but is heavily indebted. A brief financial comparison of the two is given below:
Marcolin
Safilo
€million
FY 2022
FY2023
6/2024
FY 2022
FY2023
6/2024
Revenue
547.4
558.3
297.6
1076.7
1024.5
532.0
Gross Profit
319.0
337.9
190.4
597.4
585.7
319.2
GP (%)
58.2%
60.5%
64.0%
55.5%
57.2%
60.0%
Recurring EBIT
25.7
47.4
36.7
53.5
49.6
30.6
Pretax
1.0
16.8
20.4
64.1
22.4
24.8
Net debt (ex leases)
166.2
374.7
368.9
69.6
43.7
62.6
Click to enlarge
PAI Partners are looking to exit the Marcolin business and engaged Goldman Sachs to assess interest. There should be no real interest from the other three major groups, since the sales are incidental to Luxottica – besides the obvious regulatory intervention. Kering and LVMH are brand owners, not manufacturers for others. The magnitude of brand value can be seen in the Marcolin net debt figure movement in 2023: in April 2023, the company paid Estée Lauder US$250million for a perpetual license agreement on the “Tom Ford” brand (c.f. Safilo $38million for David Beckham)
In our opinion, if reports published in June 2024 are correct26, PAI Partners must live in a different universe to everyone else. Safilo made an undisclosed offer to acquire Marcolin, but apparently the offer was “reportedly incompatible with the company’s valuation of €1.35 billion”.
It is at this point it becomes clear why we have spent considerable time on an investment worth 2% of market capitalisation and less at realistic value. There is obvious logic in a merger with Marcolin – the balance of power will shift away from the non-major brand owners towards these merged “oligopoly” manufacturers – but anything Safilo does must be driven by HAL as its major shareholder and the backstop funder.
Will HAL be prepared to invest a further (say) €300million27 to assist Safilo in acquiring Marcolin? Will they be hard-nosed and figure that Marcolin’s main tranche of debt (€350million) comes due in 2026? Will a third-party player see an opportunity to acquire both? Something has to happen, since neither company can afford to keep paying to renew their contracts. There are potentially other players in the mix – privately owned deRigo by the eponymous family (Fila, Chopard, Furla amongst others) or the US based Marchon/VSP (Paul Smith, Ferragamo, Calvin Klein and Mrs. David Beckham). Is there sufficient money available for HAL to extract themselves from Safilo via merger? At around 10x EBIT (14x P/E) the equity market’s pricing of Safilo at present appears to reflect this balance. We expect a deal, one way or the other in 2025.
Portfolio thoughts – where to?
One of the subtle issues with closing HAL’s NAV discount is that two of the portfolio holdings – Vopak and SBMO – are immensely complex to analyse, especially with lease and JV accounting. That becomes a deterrent to analysing HAL because prospective investors just take the stock prices of the two and dig a little deeper. If HAL interacted with the investment community, in our opinion, there would be a better understanding of Vopak and SBMO.
It would not surprise if HAL moved to increase its Technip Energies holding. The issues with Safilo are dealt with in detail – some move from the status quo by mid-2026 seems inevitable.
UNLISTED BUSINESSES: analytically neglected – upside from more than Boskalis
At end December 2023, the last disclosed number, HAL carried their unlisted subsidiaries/associates at a valuation of €7,145million as follows; our estimates of value discussed in this section are appended:
€million
2023
2022
East 72
comment
UNLISTED MAJORITY OWNED
estimate
Broadview Holding B.V.
758.7
798.2
671
See 2A
Timber and Building Supplies Holland N.V.
332.9
325.7
634
See 2B
IQIP Holding B.V.
250.8
–
250
See 2C
ProDrive Technologies Group B.V.
159.2
81.0
159
See 2D
MSPS Holding B.V. (formerly Infomedics Holding B.V.)
144.9
131.7
625
See 2E
Van Wijnen Holding B.V.
142.6
148.1
143
No comment
Anthony Veder Group N.V.
138.9
133.5
132
See 2F
GreenV B.V.
128.1
96.2
128
No comment
Auxilium
nd
nd
175
See 2G
Other†
393.8
461.2
308
adjusted
TOTAL
2,449.9
2,175.6
3,225
Koninklijke Boskalis B.V.
4,441.7
4,160.7
8,750
Section 4
Coolblue Holding B.V.
253.5
251.6
320+
See 2H
GRAND TOTAL
7,145.1
6,587.9
12,295
Click to enlarge
Source: p131 HAL Trust 2023 Annual Report and East 72 estimates
† FD Media (business news), Ahrend (fit out), RyK (eyewear in Chile), HR Top Holding (certification), AN Direct (hearing aids), Atlas (labour hire)
Click to enlarge
In each annual report, HAL discusses about 15 businesses, providing little other tan revenue, EBITA and a perfunctory sentence on conditions, number of employees and the year in which HAL originally invested in the business. The purpose of this section is NOT to discuss and value each business. Given the van der Vorms charitable instincts towards Rotterdam and the Netherlands generally, there are businesses which they appear to have altruistically funded. From an analytical standpoint, FD Media groep clearly pays its way with €16million of operating profit as the published of ” het financieele daglad” – the Netherlands Financial Times- plus its associated media. However, the pricing of old world media which doesn’t have a proprietary statistical appendage (e.g. Wall St Journal for News Corp) is valued very lowly; arguing the case for higher multiples doesn’t move the needle. Similarly, the €1.23billion turnover van Wijnen housebuilding business is at a low ebb, and it’s pointless to increase the valuation or push it down to nominal levels.
The table below shows business level EBITA contributions since 2018:
€million EBITA
2018
2019
2020
2021
2022
2023
Broadview Holding B.V.
54
81
56
53
43
53
Timber and Building Supplies Holland N.V.
49
57
73
132
89
48
MSPS Holding B.V.
13
26
25
34
42
48
van Wijnen
21
28
19
3
Ahrend
7
12
-4
4
3
12
Anthony Veder Group N.V
22
23
17
25
24
42
Atlas
9
6
3
5
4
3
FD Mediagroep
7
8
11
18
16
16
Auxilium
20
22
22
Divested businesses
6
12
11
68
12
28
SPECIFIED
167
225
213
387
274
275
Other
10
8
15
17
(22)
34
PER HAL ANNUAL REPORT (ex Boskalis)
177
233
228
404
256
309
Source: HAL annual reports compiled by East 72
Click to enlarge
We note that:
we ascribed a value of €3,225 to the collective (prior page) which in total equates to 9.9x estimated EV/EBITA for 2024 (€325million) but covers a real business mix; Broadview’s roll-up of laminate businesses is yet to pay off; The two health related businesses – practice management/billing and aid equipment are likely very underpriced at their carrying value; Additional investment in Coolblue suggests potentially significant valuation upside (if successful) but not for a couple of years; and Overall, investors’ view on the valuation of HAL’s unlisted businesses have been tainted by the ProGamers and ProDrive experiences, together with a few dull ones which have been around a while,D reducing their inclination to dig deeper.
The analysis below focuses on seven businesses of interest where we want to:
Verify a ~ €500million valuation in the context of a €10-11billion market capitalisation; Highlight some businesses which look really interesting for valuation uplift, further investment and build out and have dug deeper into the KVK28- HAL seem to have a great niche in ancillary health; and Coolblue where the €3billion float isn’t a happening thing, but the businesses is being accelerated somewhat.
Boskalis is dealt with separately in section 4.
Broadview Holding: specialism in high-pressure laminates but overpaid for low growth acquisitions
Broadview, which was incorporated in 2008, continues to operate a small energy distribution business (turnover ~€86million) but is built around a series of “HAL roll-up style” acquired businesses with a €1.3billion turnover mainly specialising in high-pressure laminates for use in external and internal decorations and surfaces. Broadview is heavily funded by over €500million in internal loans and has struggled for real growth over an extended period. The company issues its own separate accounts, which are especially useful in deciphering the HAL version of events.
Trespa is a Dutch cladding manufacturer acquired in March 1996 by HAL from Hoechst AG, mainly manufacturing external cladding and was the initial investment into what HAL terms its “material technology” cluster. In August 2008, Broadview added the €80million turnover Italian business Arpa Industriale, mainly specialising in internal cladding and design products at a cost of €79million, creating Broadview as the holding company for this business focus at the same time.
In May 2018, Broadview reached agreement with Gethalia Foundation to acquire its ordinary (voting) and non-voting preference shares in the German listed Westag & Getalit AG, giving Broadview a 75% voting stake in the company and requiring a takeover offer to the Frankfurt-listed company (ticker WUG.FRA). Broadview’s offer to minority shareholders was not well received, and Broadview still holds only 73.5% economic interest – despite a buyback of non-voting shares – and 83.5% stake. WUG.FRA shares still trade (very thinly) around the €31/share offer – valuing the whole company at €141million, reflecting the fact that revenue from the laminate, frames and doors business has not grown from the 2017 levels of €234million some seven years later.
In 2019, the struggling NZ-based construction and building materials concern, Fletcher Building, sought to sell Formica, the world’s largest high pressure laminate business, having fallen in breach of its debt covenants; Fletcher had acquired the business in 2007 from Cerebus Capital and Oaktree for US$700million29 having earned a “normalised” EBITDA of US$75million on revenue of US$737million in calendar 200630. Fletcher’s cycle-peak acquisition was shown in the final year to June 2019 revenues of US$600million equivalent and EBITDA of US$49million twelve years later.
In a logical step, Broadview acquired Formica in June 2019; in a not so logical step, it paid €680million (US$840million) for the business. Distressed seller, overly keen buyer, unfortunate pre-COVID timing.
In July 2020, Broadview acquired the UK business Direct Online Services, which is a multichannel seller of kitchen worktops, for €44million. Hence, on our estimates, aside from Trespa, Broadview has shelled out €950million for its four major laminate related acquisitions.31 32
Valuing Broadview
HAL’s major issue in creating a “cluster” of material technology companies – to date – is that the industry has been in a downturn across the western world since 2019. Growth in housing starts and other construction activity has been mundane, resulting from the financial impact on builders from supply side inflation, despite ultra-low interest rates until 2022.
A guide as to the structural imposts of the past few years can be seen from this simple table of financials comparing FY23 with revenue and EBITA in the year prior to acquisition – note that incremental acquisitions have been minor:
€million
Formica
Westaq
Arfa
Trespa
DOS
Acquired
2019
2018
2008
1996
2020
price
725
103 (147)
79
n/a
44
Revenue yr-1
632
234
80
189†
54
EBITA yr -1
44
8.8
n/d
25†
n/d
2023 revenue
608
199
193
180
41
2023 EBITDA‡
67.3
15.6
15.7
35.8
0.1
Click to enlarge
However, slow growth in operating profit measures at Broadview disguises significant cash flow. As a guide, depreciation and amortisation (excluding right of use assets) has averaged €78million per annum over the past three full years; that’s well over TWICE capital expenditure (€36million). We can derive a very different picture and healthier valuation by adjusting Broadview’s cash flow over the past three full years as follows, but assuming 100% ownership of Westag(below):
Calendar year €mn
2021
2022
2023
Operating cash flow as stated
69.9
62.2
93
add back tax paid
14.8
10.5
15.2
add back net interest
23.3
23.4
28.5
deduct effective rental payments
-14.5
-16.1
-17
deduct intangible investments
-5.9
-4.5
-4.8
Adjusted pre tax pre interest cash flow
87.6
75.5
114.9
adjust working capital change (add back adverse)
10.9
12.1
-20.7
Normalised pre tax pre interest operating cash flow
98.5
87.6
94.2
Capital expenditure
-36.9
-39.1
-33.3
Normalised pre-tax interest FREE cash flow
61.6
48.5
60.9
Click to enlarge
There are relatively few cohort listed companies in the space; our preferred comparative is the US$10billion listed Mohawk Industries (MHK) which like all others has a cyclical and slow long term growth profile – EBITDA in 2024 remains 20% below the 2017 calendar year.
However, the company appears priced for its free cash flow production, which has averaged US$800million before tax and interest33 in the past three years. Based on MHK’s equity value of US$9.8billion and just over US$2bn of net debt, the company trades at a valuation of 6.85% pre-interest, pre-tax free cash flow yield.
Applying this valuation to Broadview’s historic three-year average provides an enterprise valuation of ~€833million. At end 2023, Broadview was carrying net external debt of €120million (plus shareholder loans of €505million). Hence, we believe Broadview equity value, assuming 100% of Westag, to be around €713million.
Whilst the Westag “holdouts” would have arguably been better accepting the Broadview offer in 2018, having made no money in six years and seen no profit growth either, since EBITDA has fallen from €18.1million to €15.6million over the period. However, the minority holding in Westag is an inconvenience for Broadview. Westag has no debt and at 31 December 2023 was carrying €38million in cash which cannot be accessed other than through dividends.
The arithmetic of Broadview/HAL bidding for the minorities in Westag are compelling. To remove the 1.2million shares in public hands at (finger in air) €35 a share would require an investment of €42million, leaving the effective net outlay at only €4million.
Hence, we make a negative adjustment to get to 100% of free cash flow of this €42million to our Broadview valuation, to reduce to €671million, compared to the HAL Trust carrying value of €759million at 31 December 2023.34
Having held through the entirety of this double-squeeze (low demand cost inflation) cycle, we would expect Broadview/HAL to continue to maintain ownership of these businesses at least into the next upswing. We suspect as that time approaches, private equity investors may do their homework in this interesting niche.
Timber and Building Supplies Holland (TABS)
TABS – from a financial viewpoint – is like revisiting history. The companies you find with miniscule debt, high returns on invested capital/equity (like 37% when times are good), buildings on the balance sheet, very clear culture. You wish you could separately buy shares in it. Well, once upon a time, you could, but HAL were desperate to take out the minority holders. When you look at the numbers, it’s no surprise.
HAL first invested in TABS predecessor company PontMeyer in 1999 and through the provision of equity finance, purchasing other equity owner’s interests and a takeover in July 2019 arrived at its current 94.3% position. PontMeyer was originally listed on a “second” market in the Netherlands, which was closed in 2010, but then relisted on a “SME-type” market (NPEX) from which HAL initiated the take out and delisting exercise in mid-201935. At that stage, TABS was valued at €286million (€232m equity + €54m debt), earning EBITA of €45million. HAL is still required to hold AGM’s for TABS, publishes annual reports, and has not obtained the 95% shareholding level required to “squeeze out” the “recalcitrant” minorities.
TABS owns 16 separate branded businesses which are aimed at builders and construction market professionals, divided into two groups:
trade – 7 businesses with 94 branches, mainly oriented around PontMeyer (48 branches) and Royal Jongeneel (41) which sell a wide range of building materials and related products; and importers & wholesalers across wood and assorted panels mainly aimed at the builder.
TABS is obviously cyclical dependent upon activity in the Dutch housing market, which has been hamstrung by infrastructure issues, permit delays, land shortages (see Boskalis!) and fluctuating demand profiles as tabulated below, together with housebuilding spend at fixed 2023 prices:
year
2018
2019
2020
2021
2022
2023
2024E
starts
66,000
71,500
69,300
74,000
74,560
73,000
65,000
Spend €bn
37.74
36.80
38.45
42.95
42.78
41.0
TABS Holland (€million)
Revenue
719.9
730.0
788.0
962.1
1027.1
916.1
Gross Profit
205.7
213.1
244.3
322.3
297.7
261.9
EBIT
49.5
55.3
70.7
132.4
87.7
46.3
Source: FEIC; ING Bank; TABS company accounts
Click to enlarge
TABS main competitors are owned by private equity: Praxis with 184 NL locations (turnover €1.4billion) is part of KKR’s Maxeda business, whilst BME Group, which was the separation of CRH’s “retail” business is owned by Blackstone.
We believe the two most comparable European companies are the UK listed Travis Perkins (TPK.L) and Grafton Group PLC (GFTU.L). Both are suffering with low levels of profitability relative to peak illustrated below:
at 30/9/24
£million
Equity Value
Net debt
EV
2024 EBIT
(est)
Peak EBIT
2021
EV/EBIT 2024E
EV/EBIT
peak
Grafton
2,072
(361)
1,711
164
288
10.4
5.9
TPerkins†
1,941
233
2,173
152
353
14.3
6.2
Click to enlarge † notable current losses in “Toolstation” business source: tikr.com
Click to enlarge
If we average the two UK company multiples of current year depressed earnings – which are well down on 2023 in each case, consensus EV/EBIT averages out at about 12.2x; given the cyclicality in the industry, if we rejudge based on recent peak earnings in 2021, the enterprise is priced at ~6x EBIT.
TABS carries a mere €8.2million of external debt, so virtually all the valuation is applicable to equity. Applying these multiples to TABS gives an estimated equity value range of €557m to €786million, averaging €672million (100%) or €634million to HAL’s share. This compares very favourably with HAL’s carrying value of €333million, and the implied value of equity from the 2019 takeover of €232million. Since that time, the company had the benefit of three very profitable years and has retired about 6% of equity. Applying our valuation to TABS equity base gives an implied value of just over €106/TABS share (6.332million) against the €34.24/share offer(6.768million).
Little wonder there was disgruntlement amongst the minority, and HAL played “hard-ball” to obtain as many shares as possible. We have revalued HAL’s share of TABS in our valuation to €634million. In doing so, we are well aware that 2024 will be another tough year for the business; but cyclical businesses like these have valuations which properly reflect the down and upcycles; without delving behind the numbers, we suspect investors don’t realise the inherent upside from carrying value within TABS.
Whether regulators would allow is a genuine question, but a purchase by KKR or Blackstone could yield even greater numbers than ours given the ungeared nature of the business.
IQIP
In March 2023 HAL completed the acquisition of IQIP, a supplier of foundation and installation equipment to the offshore wind, coastal & civil and oil & gas markets from Royal IHC under an effective bail-out exercise. In August 2023, HAL announced it had agreed to sell 40% of IQIP to a subsidiary of Ackerman’s and van Haaren36(ACKB.BR) and 20% to MerweOord B.V. with the option for MerweOord to increase its shareholding to 33.33% during 2024. Upon exercise of this option, this would result in HAL, AvH and MerweOord each owning one-third of IQIP’s shares. All parties have terminated the transaction due to significant delays in obtaining regulatory clearances.
In the absence of any other guidance, we use HAL’s book value in our estimates.
ProDrive Technologies
ProDrive was the second of HAL’s “tech disasters” in the past three years. In February 2022,HAL invested €210.6million for a 31.4% stake in ProDrive, a manufacturer of high-tech electronics, software and mechatronic products and systems to supply customers such as ASML and Philips. Within ten months, HAL was forced to significantly impair €93million of good will and take a total write-off in the 2022 year of €129.6million. The root cause was ProDrive being unable to meet expected results as a result of personnel and material shortages, which led to a second transaction in March 2023 at a significantly lower price than the first.
In the second transaction, HAL acquired the shares of ProDrive co-founder Hans Verhagen to increase their interest to 47.2% and carry the holding at €159million. We have no information on the debt/preference share construct of ProDrive and rely on the audited carrying value. Given 2023 EBITDA of €66million, an implied 100% company value of €337million seems reasonable.
MSPS Holding
MSPS (medical Software and Processing Services) has evolved from HAL’s acquisition of Infomedics in 2012. The business now has five entities involved in two areas:
Factoring and clearing transactions for healthcare providers, giving them early payments from health insurers and invoicing the clients of the practice (two businesses); and Three businesses which have practice management software for dental practices, varied as to the sophistication of the procedures being undertaken
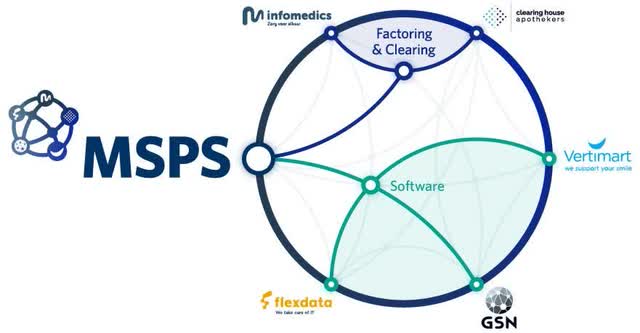

With a mix of acquisition and strong organic growth, MSPS has grown EBITA rapidly from €13million in 2018 to €48million in 2023, including 14% in the last full year. Whilst HAL provides few financial details, the implicit annuity nature of the business, captive market, assumed high margins (software base) suggest with trepidation given lack of financial data – that a €145million valuation for 95.1% of the company is not realistic.
In December 2023, MSPS effected a corporate restructure to create a new “holding company” MSPS Groep BV, with the business of Infomedics transferred across for an intercompany loan of €123.8 million; something seems afoot since – for reasons we can’t articulate – the company has sought a consolidation exemption:
![]()

Because of the lack of consolidation, MSPS Groep numbers do not match the “consolidated” EBITA numbers in the HAL accounts, mainly reflecting Infomedics, but we can glean a sense of how very profitable and remarkably high return on capital the business is:
Year to December
2022
2023
2022
2023
Revenue: services
60.6
70.4
Equity base
93.4
46.1
Revenue: licences
3.9
12.1
Debt
12.1
37.7
TOTAL
64.5
82.5
ROIC (est)
29.7%
44.0%
EBITA
31.4
36.9
HAL accounts EBITA
42
48
Click to enlarge
In our opinion, these types of business services operations, with a high margin software licence overlay trade at very significant multiples of EBITA; there are few direct listed comparatives, but with the business effectively valued at 3-4x EBITDA makes little sense. We believe that the ability to export the system elsewhere in Europe and the strong underlying growth and returns on capital make this far more valuable, more akin to 13x EV/EBITDA. On that basis, we view MSPS as worth €625million.
Auxilium
HAL became involved with Auxilium in 2010 since it owned a very similar business, Livit, in the Netherlands. Livit was sold to the German company Ottobock in May 2022 for an undisclosed amount. Ottobock is a major leader in protheses, orthopaedic treatment and devices, wheelchairs and other “medical aids” As a guide, Ottobock sold a 20% stake in itself to EQT, the Swedish private equity investor valuing the whole company at €3.15billion. The Nader family bought the stake back at an implied value of €5.5billion – 3.67x sales for 2023 (€1500million) and over 19x EV/EBITDA (€280million). These businesses are highly valued – Ottobock has 390 patient care centres globally with significant clinic and doctor relationships.
HAL owns 53% of Auxilium which operates 85 medical equipment centres across Germany as a holding company for 14 separate businesses. . HAL has only reported Auxilium separately since the sale of Livit revenues have grown ~5%pa since 2021 and EBITA was €22million – up 10% on two years prior in 2023.
It’s not reasonable to value Auxilium at Ottobock levels, but HAL’s stake could reasonably be ascribed an EV of €150 – €175million based on low-mid teen EV/EBITDA multiples./ A Swiss private equity firm, Credit Mutuel Equity acquired a stake in the business from an initial investor, btov Partners in May 2018.
Anthony Veder Group
AVG is a specialist ethylene and LNG gas shipping company with a fleet of 28 vessels + 1 managed; 11 of the vessels are specific LNG tankers. This is one of HAL’s longest standing investments since 1991.
AVG had various shipping and port agency activities from its foundation in the 1930s, ran passenger vessels for a period to the late 1950s. The company – operating out of Curacao – ran a business operating refrigerated shipping from 1961. In a logical next step, in 1969 AVG acquired its first ammonia transportation vessel.
Twenty-four years after the death of the eponymous founder, the surviving family sold the business to HAL (63%) and the van der Vorm family (37%). HAL were instrumental in stripping away the miscellaneous activities so typical of shipping companies, and focused on building a fleet of gas tankers, with more recent emphasis on the burgeoning LNG market.
AVG’s fleet are tiny vessels relative to the Korean LNG carrier behemoths; AVG have three 30,000 cubic metre vessels versus the Qatari QMax monsters with 250,000 cbm capacity, and so appear to run pan-European operations.
HAL provides no operational statistics for AVL such as day rates and operating capacity which inhibits analysis of the company even with the benefit of full accounts. These types of business have significant operating leverage, which is supplemented in AVG’s case by net debt of US$350million :
Year to DecemberUS$mn
2022
2023
US$million
2022
2023
Revenue
240.6
253.1
Estimated day rate
$24,400
$24,765
Interest charge
(14.6)
(20.2)
EBITDA
67.2
90.2
NPAT (no tax)
10.5
21.1
D&A
(42.3)
(48.8)
Debt
377.2
350.0
EBIT
25.0
41.4
Click to enlarge
The closest approximation to a listed cohort for AVG, in our opinion, are the VLCC listed tanker companies. Their equity is highly volatile, often acting inversely to the price of oil (low price, storage required) and to the extent of capacity in the industry. Spot charter rates vary dramatically; for DHT International (NYSE: DHT) – for example, in CY2022, average rate was US$29,000/day. In a tight market in Q2 2023, the rates averaged $64,800 a day.
Our two favoured cohort securities are NYSE listed Frontline plc (FRO) and DHT (above). At end September, as normal FRO traded a EV/EBITDA and PER point above DHT; averaging 9x NPAT and 6.8x EV/EBITDA. If we apply these multiples to AVG, we arrive at a mid-point valuation of $227million for AVG equity.
HAL owns 62.9% of AVG suggesting its equity share to be worth US$142million or €132million versus carrying value of
Coolblue
Coolblue was founded in 1999 by Pieter Zwart – still its CEO – and two colleagues. The company is ostensibly the Netherlands e-commerce answer to Amazon, but with greater similarities to Australia’s Kogan Limited (KGN.AX) given its wider offerings in supplying electricity in its home market. Coolblue also operates in Belgium and Germany and has 31physical stores (18 NL; 10 BEL and 3 in Germany)
Sales have grown from €555million in 2015 to€2.4billion in 2023, 20% pa CAGR but have plateaued at €2.3 – €2.4bn post COVID. In early 2020, with sales at just below €2billion and margins at 5.7%, the company mooted an IPO with a rumoured valuation of €3billion. Having invested in 2016 at a 20% share, and then increasing the stake to 49% by 2019 at a total cost of €250million, HAL stood to make a relatively short-term killing of over €1billion on paper.
The bursting of the COVID e-commerce valuation bubble finally put paid to the potential IPO in October 2021, as profits started falling from their peak. HAL has carried its interest in Coolblue -48.9% – at roughly €253million for some time.
In August 2024, management and HAL injected a further €50million into the business and HAL acquired a 7.5% shareholding of existing stock from Pieter Zwart, to take its stake to 56.4% and facilitate Zwart’s portion of the new capital. HAL does not have consolidation capabilities. Zwart, HAL and a small management holding are the only shareholders, the other founders having cashed out in 2016 to HAL. This is clearly a big deal for Zwart, dipping below 50% economic interest, albeit with control restrictions, showing the energy for a significant expansion.
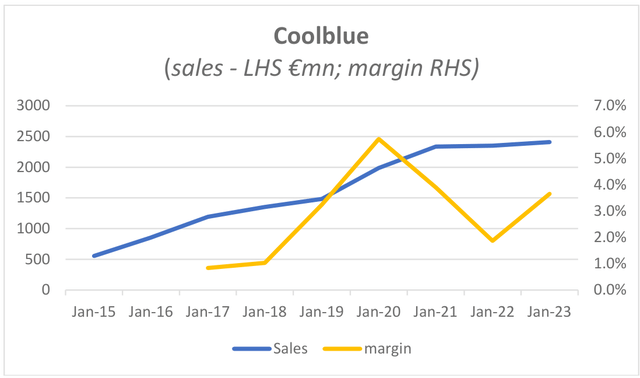

Coolblue is investing a total of €150million to flesh out the growth opportunity in Germany, with 36 new stores and 9 delivery depots to be opened. The company is highly customer-centric37 and the basis of the expansion suggests potential per annum sales of €4 – €5billion within three years.
At current valuations, Coolblue is valued (€568million for 100%) at 6.5x EV/EBITDA and 21x net profit in 2023 (€22.6million). Hardly a stretch. However, with the growth investment, it has to be expected that profitability may falter over the next 1-2 years before the new stores mature. If Coolblue can replicate the Netherlands/Belgian success in Germany, and maintain margin, there is real (back of the envelope with a crayon) potential for the business to start to approach the IPO valuation in 4-5years time (€5billion sales at 6% margin x 10EBITDA multiple) potentially giving HAL another €1billion+ windfall on its current stake valued at €320million post new investment. It’s worth noting that HAL’s most successful realised investments have been in consumer retailing: eyewear and hearing. Bluntly, it’s one of the more exciting things about HAL in the near future
REAL ESTATE : successful and high returns on invested capital
In 1983, Holland America Line moved its US HQ from the East Coast (Stamford, CT) to the west in Seattle, WA to facilitate a greater linkage with its tour subsidiary, Westours. This started an effective love affair with the city, which was cemented-post sale of the cruise line – by the creation of HAL Real Estate (HALRE) in 1993. In assessing family holding companies, the existence of real estate, in the prevailing environment is usually a major turn-off; many have accumulated office blocks over a period and now find them with higher vacancy rates and subject to requirements to re-fit or rebuild, especially if US located.
By contrast, HALRE has generally had smaller investments in office properties as a result of holding €120million+ exposures to four office buildings in Seattle in the 2002-2006 period when vacancy rats rose to 35% in the relevant properties.
Moreover, HALRE has been prepared to be countercyclical and since 2017, operate far more in partnerships and joint ventures focused on multifamily communities. It’s an approach that continues to be highly successful.
Since 2002, with modest exposures, HALRE has generated capital profits of €313million, rents and similar income of €227million and overall returns, after costs of €423million – an average just below €20million a year. HALRE has had major peaks with specific project sales in 2005 (€66mn), 2011 (€53mn), 2021 (€50mn) and 2022 (€58million).
At 31 December 2023, HAL held €226million of US real estate split across its interest in fifteen residential JVs comprising 2,400 apartments and 98 town houses in Seattle with an equity commitment of just less than €350million, plus two office property JV’s. Recent results point to >50% return on investment from the apartment projects which will come to fruition in the current and next two years. In H1CY24, HALRE with its partner Main Street Property, sold a 159 unit multifamily property for US$71million (€64million) and a capital gain to HAL of €26million to be book in H2CY24.
HAL also owns three shopping centres in Holland in Alphen aan den Rijn (an hour north of Rotterdam), in a suburb of Eindhoven and in Rijswijk, an outer suburb of Den Haag, woth the aim of adding resiential space and upgrading the centres; the three are carried at €63million.
BOSKALIS: the key driver of valuation uplift
HAL acquired the ~54% of Boskalis it did not own via a takeover offer in mid-2022 at €33 per share, valuing the whole company at €4.267billion. We think it is worth far more than that – more than twice as much at €8.75billion. HAL’s timing was masterful, coming almost co-incidentally with Ackermans and van Haaren spinning off a major competitor, DEME at much higher valuation parameters.
Dredging and related services is a growth business, strongly rebounding from COVID
Dredging services are an especially intriguing business, influenced by macroeconomic trade factors, politics and environmental forces influencing demand for the services. However, it is an unconventional industry from both the demand and supply side, with “open” and “closed” contracts, which require hefty capital investment, dominated by five global companies each of which has some level of protection by “in- market” Government contracts.
The five key demand drivers for dredging are:
global trade, with larger vessels requiring deeper ports and harbours – with their ongoing maintenance – plus new port development, notably in Asia within the shipping industry but also in areas of natural resources port access; offshore energy, notably in Europe, with offshore wind farms, subsea pipelines and oil platforms; land reclamation, which was the core business for four of the six majors given their base in the Netherlands (s) and Belgium (2) but with increased demand in the Middle East and in Asia as a result of urbanisation; coastal protection with climate change causing coastal erosion which requires protection barriers and beach replenishment; and general environmental waterway clean ups
The annual market size for new contracts is estimated38 at approximately €6.1bn in “open” markets excluding China and USA39, which are categorised as closed; the following quote from the annual report of the world’s largest dredger China Communications Construction Company Limited (1800.HK) perhaps illustrates why:
“As the largest dredging enterprise in China and even in the world, the Company enjoys absolute influence in China’s coastal dredging market.”
Similarly, there is annuity style income in the Belgian and Dutch markets, given the need for persistent reclamation and coastal repair. Further, in the Middle East, significant work is awarded to locally based contractors, such as the Abu Dhabi Stock Exchange listed NMDC Group.40
The major players in global dredging and offshore are all controlled companies whether publicly listed or private; given the small number of companies involved, the obvious competitive contracting nature of the business and hefty capital expenditure, secrecy is a key element, lending itself to these ownership structures:
€ million
Equity
cap (30/9)
Net debt
Enterp. Value
Revenue EBITDA
2022
Revenue EBITDA
2023
Revenue EBITDA LTM 6/24
Order book 6/24
LISTED/PREVIOUSLY LISTED – INTERIM DATA AVAILABLE
Boskalis
4,267†
(680)
3,587
3,580
4,280
4,380
5,260
EBITDA
604
1,016
1,199
3.0x
DEME
3,692
352
4,044
2,655
3,285
3,726
7,622
EBITDA
474
596
719
5.6x
National Marine Dredge§
5,307
(162)
5,145
2,757
4,205
5,473
18,400
EBITDA
377
600
826
6.2x
UNLISTED
Jan de Nul
(520)
2493
2945
na
8,900
EBITDA
440
610
na
Van Oord
152
2,021
2,862
na
4,429
EBITDA
243
379
na
CCCC ‡
6,668
6,993
6,988
nd
EBITDA
954
933
984
Click to enlarge
† at HAL Trust acquisition price
§ Calculated at €/AED rate of 3.8760 (2022) 3.9730 (2023) and 4.0322 (LTM to June 2024); rate on 30/.9/24 = 4.0923 order book is backlog
‡ Dredging division of China Communications Construction Company (global #1 but 90%+ of work in PRC)
Calculated at €/¥ rate of 7.2358 (2022) 7.6511 (2023) and 7.7760 (LTM to June 2024)
Click to enlarge
The comparative table illustrates clearly that HAL – in the near term at least -acquired Boksalis on very advantageous terms. So where and why is it that Boskalis has increased profits so rapidly?
Boskalis – historic divisional revenue and EBITDA
Dredging
Offshore Energy
Salvage
TOTAL
Order book at y/e
€mn
Rev
π
Rev
π
Rev
π
Rev
π
Dredg
Energy
Salvage
TOTAL
2011
1907.0
369.9
371.0
107.8
519.0
149.0
2797
626.7
2482
1560
596
4638
2012
2067.0
364.8
481.0
95.4
533.0
142.0
3081
602.2
2676
2236
610
5522
2013
1725.5
362.4
1067.4
274.7
363.0
103.9
3155.9
741
2001
1322.9
650
3973.9
2014
1664.8
487.5
1238.6
387.8
270.6
118.6
3174
993.9
2014
1207.4
63.9
3285.3
2015
1727.2
400.4
1233.4
418.4
294.9
96.2
3255.5
915
1506.9
975.2
7.9
2490
2016
1164.5
223.0
1333.7
374.6
121.4
55.1
2619.6
652.7
1892.5
1023.9
7.5
2923.9
2017
1298.3
219.1
972.1
221.1
100.5
35.1
2370.9
475.3
2477.4
1011.1
6.7
3495.2
2018
1428.7
243.8
1041.3
111.3
131.7
36.4
2601.7
391.5
3002.4
1281.9
7.9
4292.2
2019
1517.7
241.6
1020.4
47.4
132.1
41.6
2670.2
330.6
3192.4
1524.2
5.4
4722.0
2020
1315.7
177.3
1064.9
193.5
174.5
50.1
2555.1
420.9
4075.7
1226.8
3.8
5306.3
2021
1583.3
211.1
1266.9
222.9
106.6
28.3
2956.8
462.3
3999.8
1397.6
8.8
5406.2
2022
2067.2
318.0
1450.2
297.0
60.8
-10.9
3578.2
604.1
3440.5
2497.1
169.9
6107.5
H1 23
1969
370
5978
H2 23
2314
646
2023
2100
2000
183
4283
1016
6007
H1 24
2065
534
5260
Π= EBITDA
Click to enlarge
All of the dredging companies are recovering from a reduced workload during the COVID period, evident in the ongoing bounce in profits in the comparative table; for Boskalis revenue is up over 70% in the last twelve months over the 2020 COVID year in the two key areas. Boskalis has had some specifically large projects – notably a dredging project now completing at Manila Airport.
But it’s clearly the offshore energy area – conventional hydrocarbon and wind – which has grown sharply since the HAL takeover. The outlook for offshore energy continues to be strong based on the recent DEME interim results presentation and the wording of the Boskalis interim report; from a structural viewpoint the ongoing growth in offshore wind continues to derive revenues.
Developing Boskalis to a new level
What the equity market didn’t appreciate before the takeover was the degree to which Boskalis had upgraded its fleet, especially in the construction support area; Boskalis averaged €360million of capital expenditure a year in the 2020-2022 period and spent a massive €527million in 2023; the 2020-2022 spend is around €70million a year more than depreciation. The 2023 capex is easily covered by the massive uplift in profits.
Since HAL took over, Boskalis has started to invest significantly more in the towage area in two respects:
acquisition of ALP Maritime Group for €165million in February 2024, comprising a group of eight large anchor handling tugs, which are used to tow FPSO platforms and can be used in the offshore – especially burgeoning floating wind markets; agreement to buy the residual 50% of Smit Lamnalco, the world’s fifth-largest towage group; Boskalis had announced a deal to sell its 50% holding to Spanish company Boluda, but complications and delays put an end to that transaction; Boskalis is now buying out the other 50% held by Saudi group Rezayat Group – subject to multiple country regulatory approvals What might Boskalis be worth as a separate entity?
With HAL’s financial backing and the upswing in the cycle – which may be close to plateauing – Boskalis has been significantly upgraded over the past 3-4 years, with further earnings uplift to come; Smit Lamnalco is a $100m EBITDA business, if approvals are granted. Many of Boskalis activities are complementary to other HAL influenced businesses, notably SBM Offshore, and it is clear across the group there is a strong emphasis on “alternative energies” – offshore wind and LNG seen through Vopak, Anthony Vader, SBMO and Boskalis.
Crudely applying the average EV/EBITDA multiples of NMDC and DEME would provide an equity value of Boskalis of about €7.8billion. However, the reinvestment and incremental earnings from ALP Maritime over a full year, the residual half of Smit Lamnalco, being higher quality/rated earnings suggest that Boskalis EBIT – which in 2023 was €701million – allowing for some growth and the incremental earnings over a full year from the acquisitions would be around €800million over a full CY2025.
DEME trades at around 12.1 EV/FY25EBIT – depreciation and amortisation runs at ~ €400million a year. If we were to apply a discounted multiple of 10.5x EV/EBIT to proforma 2025 earnings and add back what by year end will be only around €350-400million of cash due to the SmitLamnalco purchase, that gives us an equity value including cash of ~€8,750million.
What are the implications?
We believe that HAL management will continue to seek out suitable acquisitions for Boskalis, especially areas of familiarity – a natural reaction to the problems of the past few years. The subtle aspect is that many of these businesses – due to the inherent nature of partnering in these industries – have complex accounting of ventures (consolidated or equity accounting) which are confusing and don’t present true pictures or the even worse problem of lease accounting.
Whilst people with diligence, an accounting and math intellect can readily/eventually work it out, time-poor portfolio managers generally find these things “too hard”. That makes it incumbent upon HAL Trust to come out of the bunker and explain, especially if a re-float of Boskalis (à la GrandVision) is part of the strategy. Having three major assets worth two-thirds of your asset base, with accounting complexities, might be a step too far. Perhaps that’s what the van der Vorms want. We hope not.
We hold a ~ 3% portfolio position in HAL Trust – it is very cheap and little is priced in – but patience will obviously be required.
For further information:
Andrew Brown, Executive Chair
Footnotes
1The ‘Rivaud Group” of companies was formed mainly as plantation companies in the late 19 th century and further developed around Banque Rivaud et Cie by successors of the Rivaud de Raffiniere family, the de Beaumonts and latterly Eduoard de Ribes from the mid-1970’s. Control of the complex inter-locking group of companies was effectively acquired by Vincent Bolloré in 1996 after raids by tax authorities and financial pressure. A full exposition of Rivaud is contained in Quarterly Report #2 (June 2023)
2Déclaration de franchissement de seuil (Odet) 6 August 2024
3AMF: Autorite des Marches Financiers – the French securities regulator
4French expert reports are usually appallingly bad, curated by an investment bank with relationships to the applicant and happily interchanging “price” and “value”
5In addition, there are arbitrage possibilities via an alternative offer of shares in Universal Music Group (UMG.AS) – the first time Bolloré have used this asset as currency.
6Odet owns just over 6 million shares in each of Vivendi and UMG – worth €200million against debt of €360million but these are incidental to this exercise
7We are very aware the recent French budget is proposing a “buyback” tax of 8% of the value of shares cancelled in the draft Finance Bill for 2025. This Bill is subject to French Parliamentary debate over the coming months in an environment where there is no overall party majority after the recent elections. Note there is a difference between outright share cancellation and holding in Treasury but not cancelling but where the effective number of outstanding shares is the same number.
8Please don’t shoot the messenger
9″Draft Simplified Tender Offer” 18 April 2023 A2EF Independent Expert Report
10Readers may wish to consult Quarterly Report #5 (March 2024) which contains a detailed review of Belron and its value to the wider D’Ieteren Group
11With apologies to Sir Winston Churchill
12EXOR Investor Relations 30 June 2024 presentation
13Deconsolidating Safilo and Vopak
14The early parts of this backstory are derived from the Elly de Leeuw Hilberts thesis
15Hundreds of examples of which: “van der Vorm: the Dutch billionaires who keep schtum” (Moneyweek 13 Nov 2019) but also “Wealthy family pays the debts of 1,000 Rotterdam households” (Dutch News 6 May 2024)
16An excellent balanced profile is in Quotenet.nl: “Investment company HAL: the hidden world empire of Martijn van der Vorm” 22 March 2020)
17Melchemie is somewhat controversial for alleged supply of precursor chemicals to Saddam Hussein to produce poison gas used in the 1980’s
18https://www.nbcnews.com/id/wbna9357853 is a good synopsis
19She has a younger brother, Willem.
20The history of Vopak to 2016 is catalogued in a pdf book “400 years of storage: Vopak 1616 -2016” available online
21This eventually provided over a €330million capital gain windfall for HAL Trust
22Someone should write the book on this company. The corporate website is magnificent with all annual reports going back to 2002 (when it was private) so the rather sad financial history is very transparent
23″An Italian Rivalry born of expertise in glass” NY Times 24 March 2006 (this is such a good evocative piece)
24Kering Press Release 21 March 2017 “Kering Eyewear and the Maison Cartier Partner for the development of the eyewear category”
25Thélios Spa was created and Marcolin acquired 49% in August 2017
26Fashion Network “Eyewear group Marcolin rejects Safilo’s bid” 28 June 2024
27Safilo enterprise value is €518million as a guide but there would be synergies and market power
28Dutch Business Register (Handelsregister). Australian Government take note that filings cost equivalent A$6.37 not the outrageous A$49 I had to pay to do research on a major Australian asset of an investee company.
30Australian Financial Review “Fletcher Building’s $900m private equity mistake” 18 April 2018
30NZ Herald “Fletcher Building buys US firm for $1 billion” 23 May 2007
31We have ignored acquisitions in gas distribution and industrial workwear; the latter businesses were sold for a €40million profit
32We have also omitted the €75million capital gain on the 8.9% stake (cost €63mn) in Chart Industries between 2016 – 2018
33We use this pre- tax pre-interest adjusted FREE cash flow i.e. deducting capital expenditure, normalising working capital deducting share-based payments and any capitalised software payments as an effective “take private” cash flow
34Page 131 HAL Trust annual report
35Don’t look for this in the HAL Annual Report; the history around the NPEX listing and aggressive takeover can be found on valueinvestingblog.net/tabs-holland – grateful thanks!
36ACKB.BR are the 62% holders of Boskalis competitor DEME Group and IPO’d the company. DEME would benefit, as would Boskalis from IQIP remaining viable – hence the proposed co-investment.
37See feelgood article https://mtsprout.nl/leiderschap/pieter-zwart-coolblue-ceo”He can get really excited about small things”
38International Association of Dredging Companies “Dredging in Figures” 2022 (seems a gross under-estimate)
39The listed US company Great Lakes Dredge & Dock Corporation (GLDD)derives upwards of 80% of revenue from Federal, state and local Government contracts based on recent quarterly reports
40National Marine Dredging Company. market capitalisation at 30 September 2024 AED21,717mn = €5.3billion
Copyright and Disclaimer
© Other than material being the property of its respective owners, this presentation is copyright 2024 East 72 Management Pty Ltd. All Rights Reserved. You may not reproduce parts of this work without permission, which can be sought by email, but you are free to distribute the work on each security (Bolloré, D’Ieteren Group, HAL Trust) in its entirety with full attribution.
This communication has been prepared by Andrew Brown and East 72 Management Pty Limited ( E72M) (ACN 663980541); E72M is Corporate Authorised Representative 001300340 of Westferry Operations Pty Limited (AFSL 302802) of which Andrew Brown is a Responsible Manager.
While E72M believes the information contained in this communication is based on reliable information, no warranty is given as to its accuracy and persons relying on this information do so at their own risk. E72M and its related companies, their officers, employees, representatives and agents expressly advise that they shall not be liable in any way whatsoever for loss or damage, whether direct, indirect, consequential or otherwise arising out of or in connection with the contents of an/or any omissions from this report except where a liability is made non-excludable by legislation.
Any projections contained in this communication are estimates only. Such projections are subject to market influences and contingent upon matters outside the control of E72M and therefore may not be realised in the future.
This update is for general information purposes; it does not purport to provide recommendations or advice or opinions in relation to specific investments or securities. It has been prepared without taking account of any person’s objectives, financial situation or needs and because of that, any person should take relevant advice before acting on the commentary. The update is being supplied for information purposes only and not for any other purpose. The update and information contained in it do not constitute a prospectus and do not form part of any offer of, or invitation to apply for securities in any jurisdiction.
The information contained in this update is current as at 30 September 2024 or such other dates which are stipulated herein. All statements are based on E72’s best information as at 30 September 2024. This presentation may include officers and reflect their current views with respect to future events. These views are subject to various risks, uncertainties and assumptions which may or may not eventuate. E72M makes no representation nor gives any assurance that these statements will prove to be accurate as future circumstances or events may differ from those which have been anticipated by the Company.
Click to enlarge
Original Post
Editor’s Note: The summary bullets for this article were chosen by Seeking Alpha editors.
Editor’s Note: This article discusses one or more securities that do not trade on a major U.S. exchange. Please be aware of the risks associated with these stocks.
Source link : http://www.bing.com/news/apiclick.aspx?ref=FexRss&aid=&tid=6712742c15fe4f4092d58a9f920ab13a&url=https%3A%2F%2Fseekingalpha.com%2Farticle%2F4727559-east-72-dynasty-trust-q3-2024-quarterly-report&c=6380439201361679993&mkt=en-us
Author :
Publish date : 2024-10-17 21:00:00
Copyright for syndicated content belongs to the linked Source.