Snow accumulation
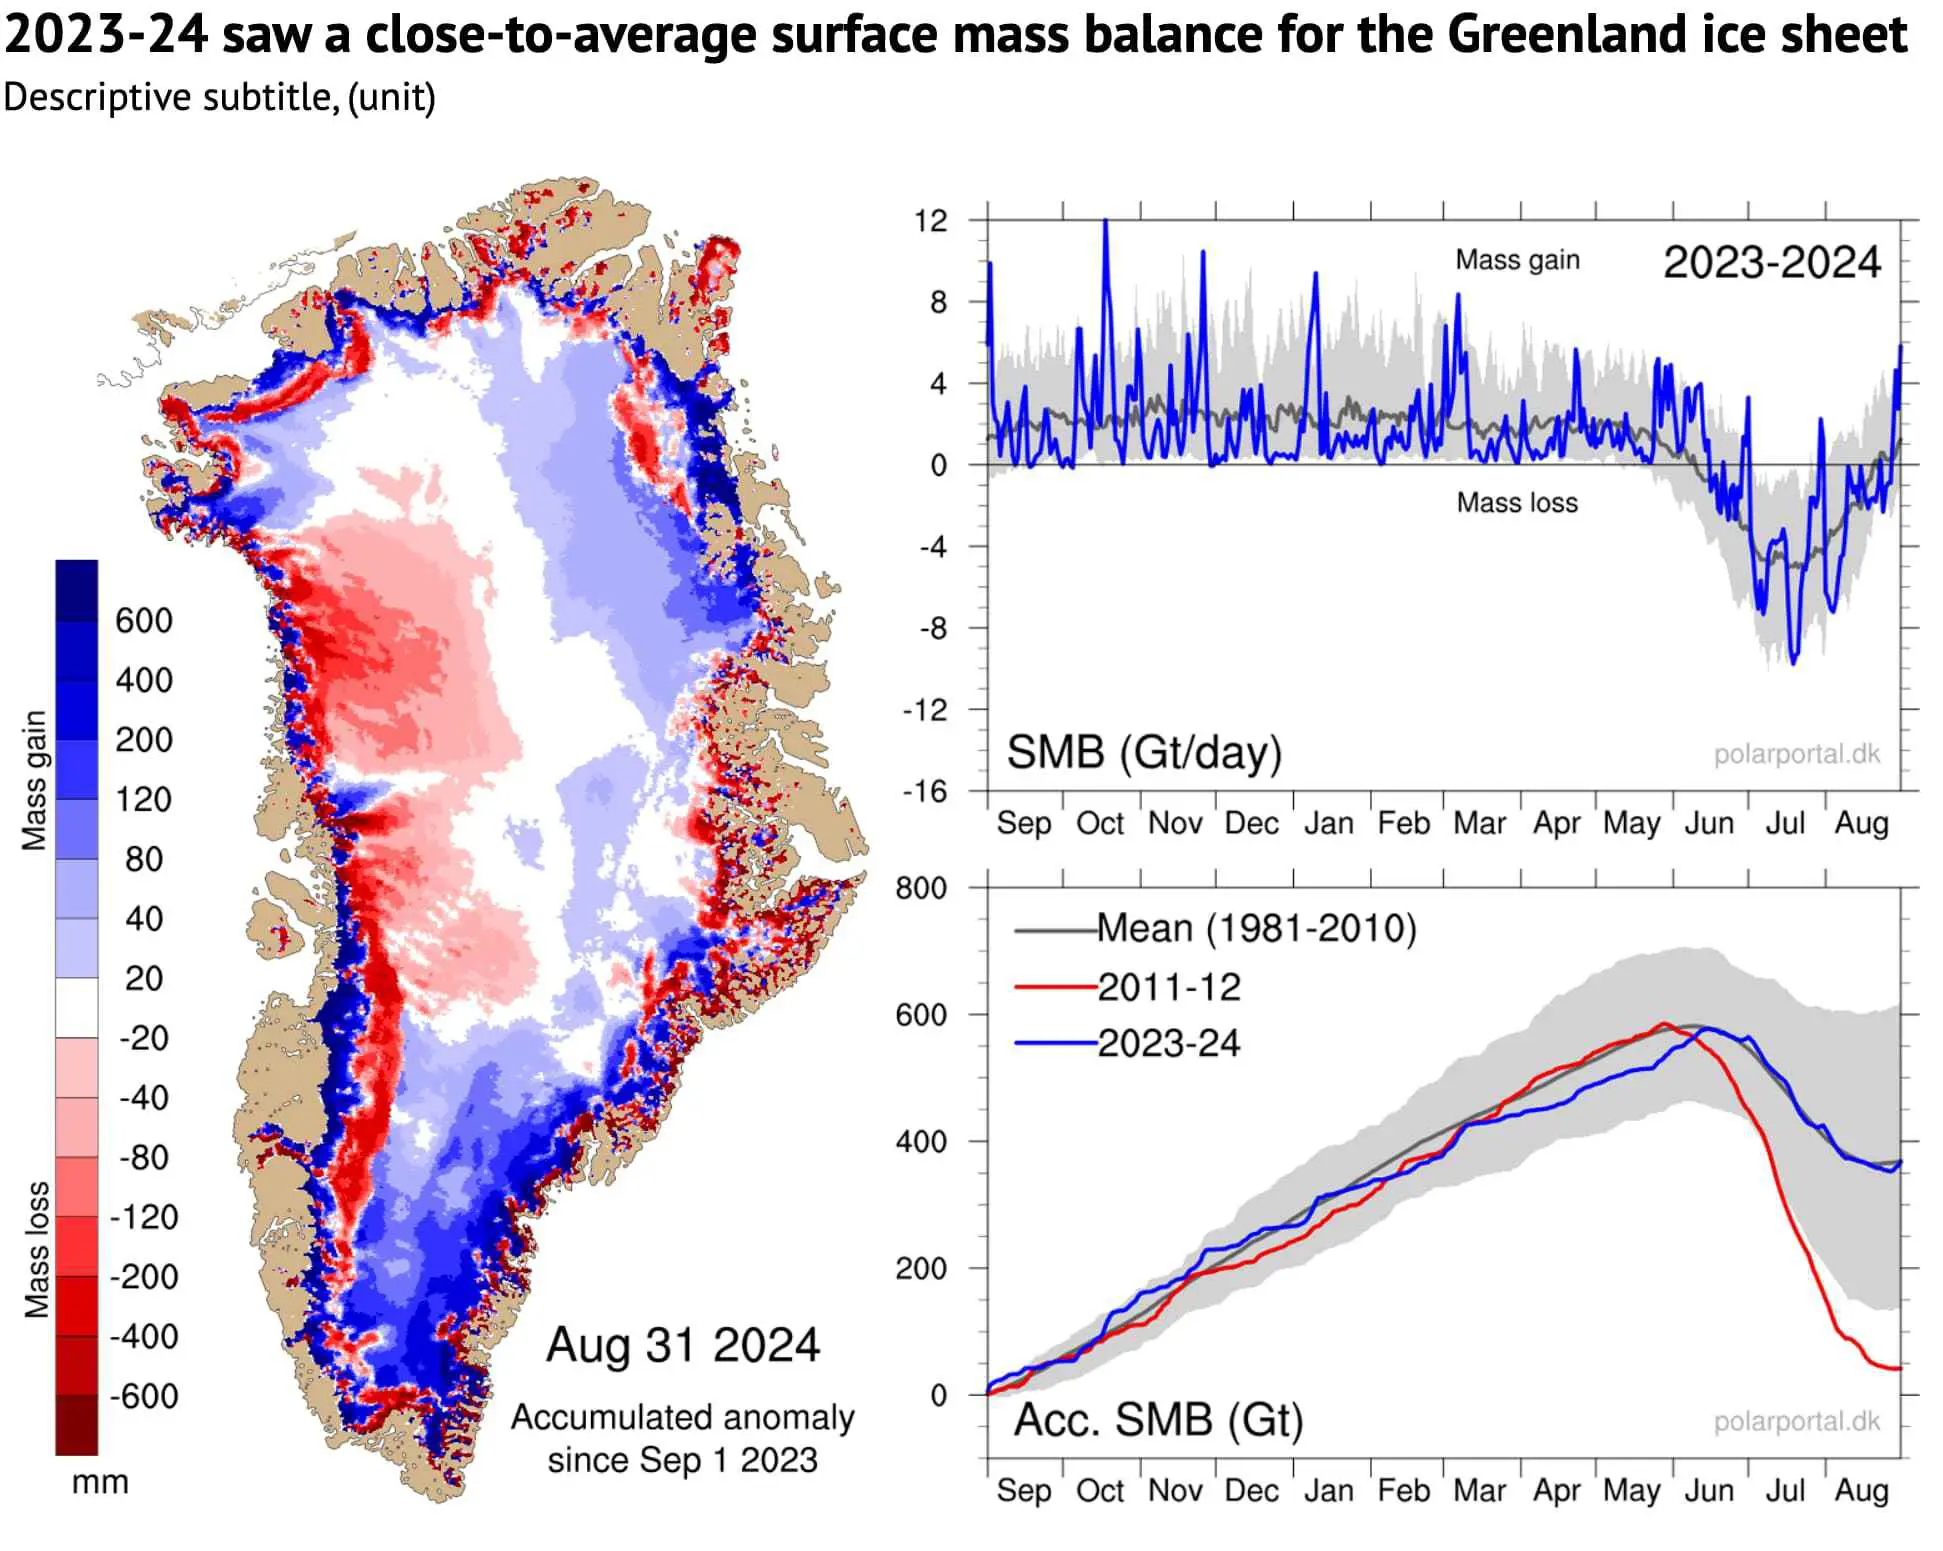
However, the surface mass budget is not just about ice melt.Â
September, October and November all saw above-average snowfall. Then, as in 2022-23, a rather dry period followed in late winter, followed by spikes in snow in March, April and May.
As a result, the accumulated SMB was close to the 1981-2010 average as melting began.Â
Subsequently, in June, several large snow fall events brought an emergency blanket back to the ice sheet, delaying the start of the “ablation” – or melt – season to 24 June, 11 days later than the 1981-2010 median. (The ablation season is defined as the first day of three days in a row with an SMB below -1Gt.)
The melt area was well above the average for the period of 1981-2010 during most of June, July and August – despite another spike in snow in August.
The left map shows the area of ice melt on 18 July – the day with the maximum melt extent (67%) of this summer (shaded in red). The map on the right shows the situation at the end of the season on 31 August when the ice sheet was well back into the winter pattern.
The charts beneath show the daily extent of melting across the ice sheet as a percentage (blue line), with the 1981-2010 average shown in grey.
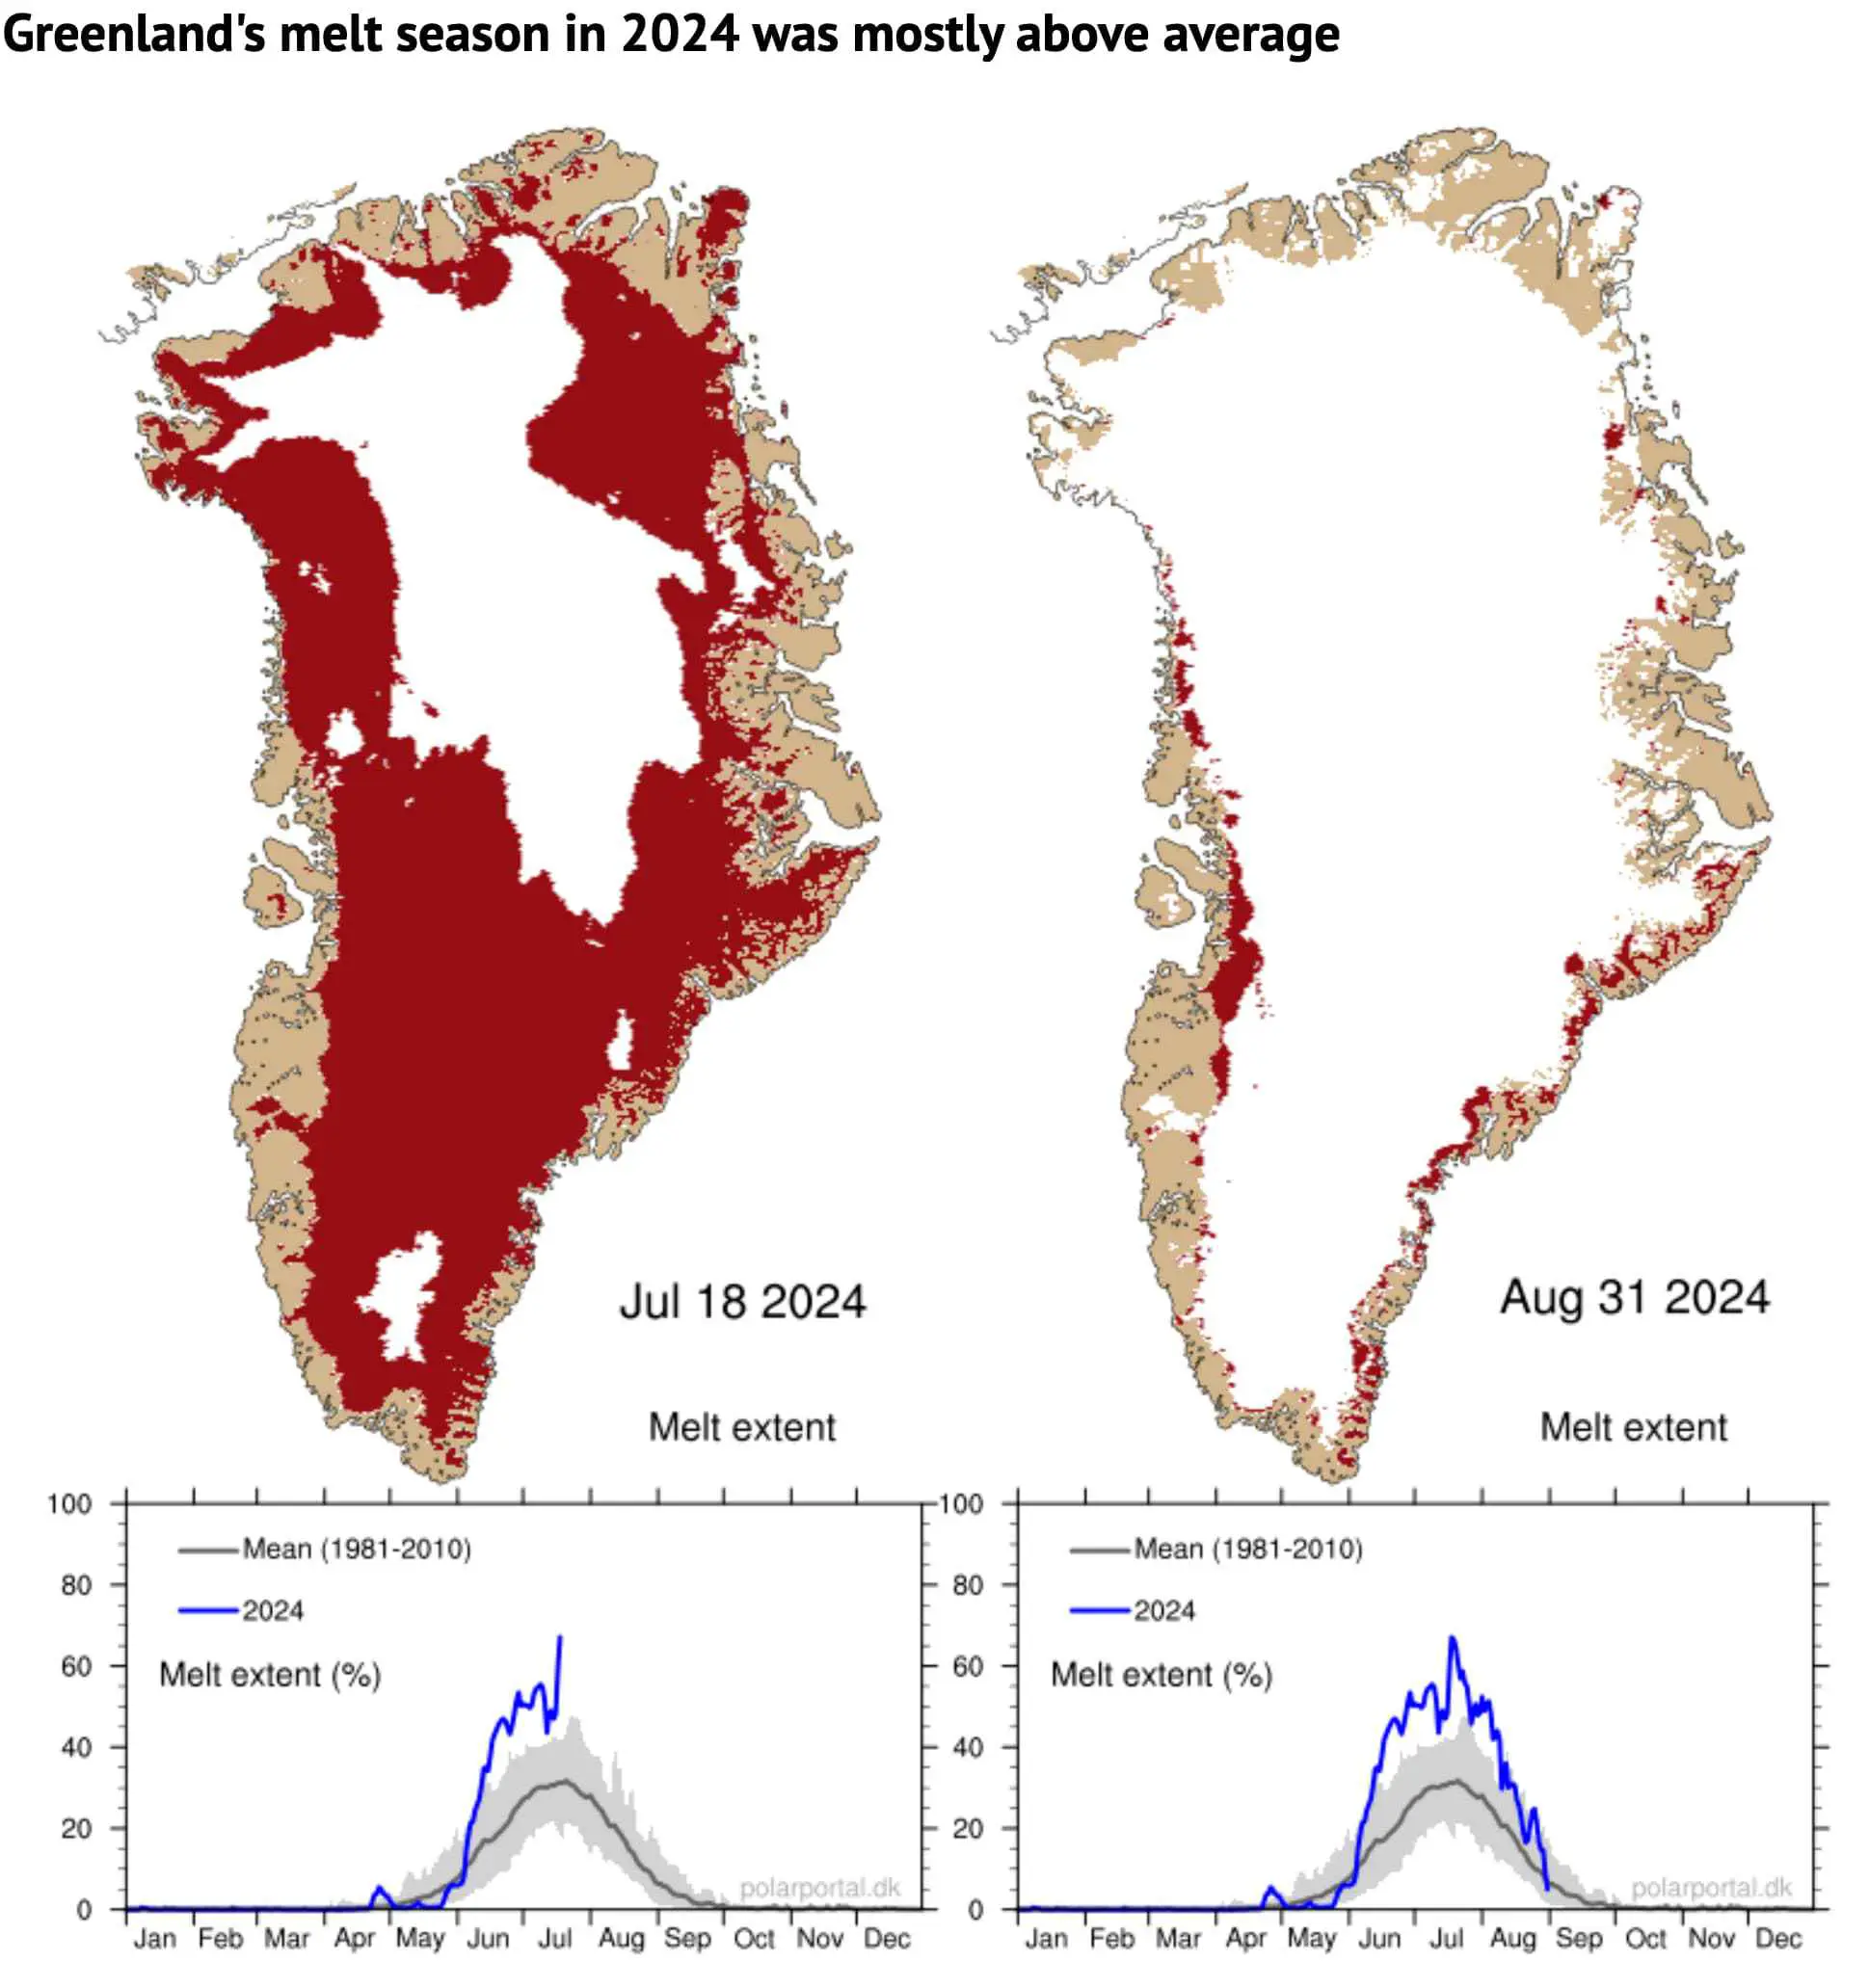 Top: Map showing areas of Greenland undergoing surface melt on 18 July and 31 August 2024 (shaded red). Bottom: Percentage of ice sheet area seeing surface melt on each day of 2024 (blue line), ending on 18 July and 31 August, respectively. The grey line shows the 1981-2010 average. Credit: DMI Polar Portal.
The total mass budget
The surface budget is just one component of the “total” mass budget (TMB) of the Greenland ice sheet:
TMB = SMB + MMB + BMB
Here, MMB is the “marine” mass balance, consisting of the breaking off – or “calving” – of icebergs and the melting of the front of glaciers where they meet the warm sea water. BMB is the “basal” mass balance, which refers to ice losses from the base of the ice sheet. This makes a small, but non-zero, contribution to the TMB and mainly consists of frictional effects and the ground heat flux.
The figure below shows how much ice the Greenland ice sheet has lost (red) going back to 1987, which includes the SMB (blue), MMB (green) and BMB (orange).
For 2023-24, the TMB ended with a loss of 80Gt of ice. This means that 2023-24 was the 28th year in a row with a Greenland ice sheet overall mass loss. As the chart shows, Greenland last saw an annual net gain of ice in 1996.
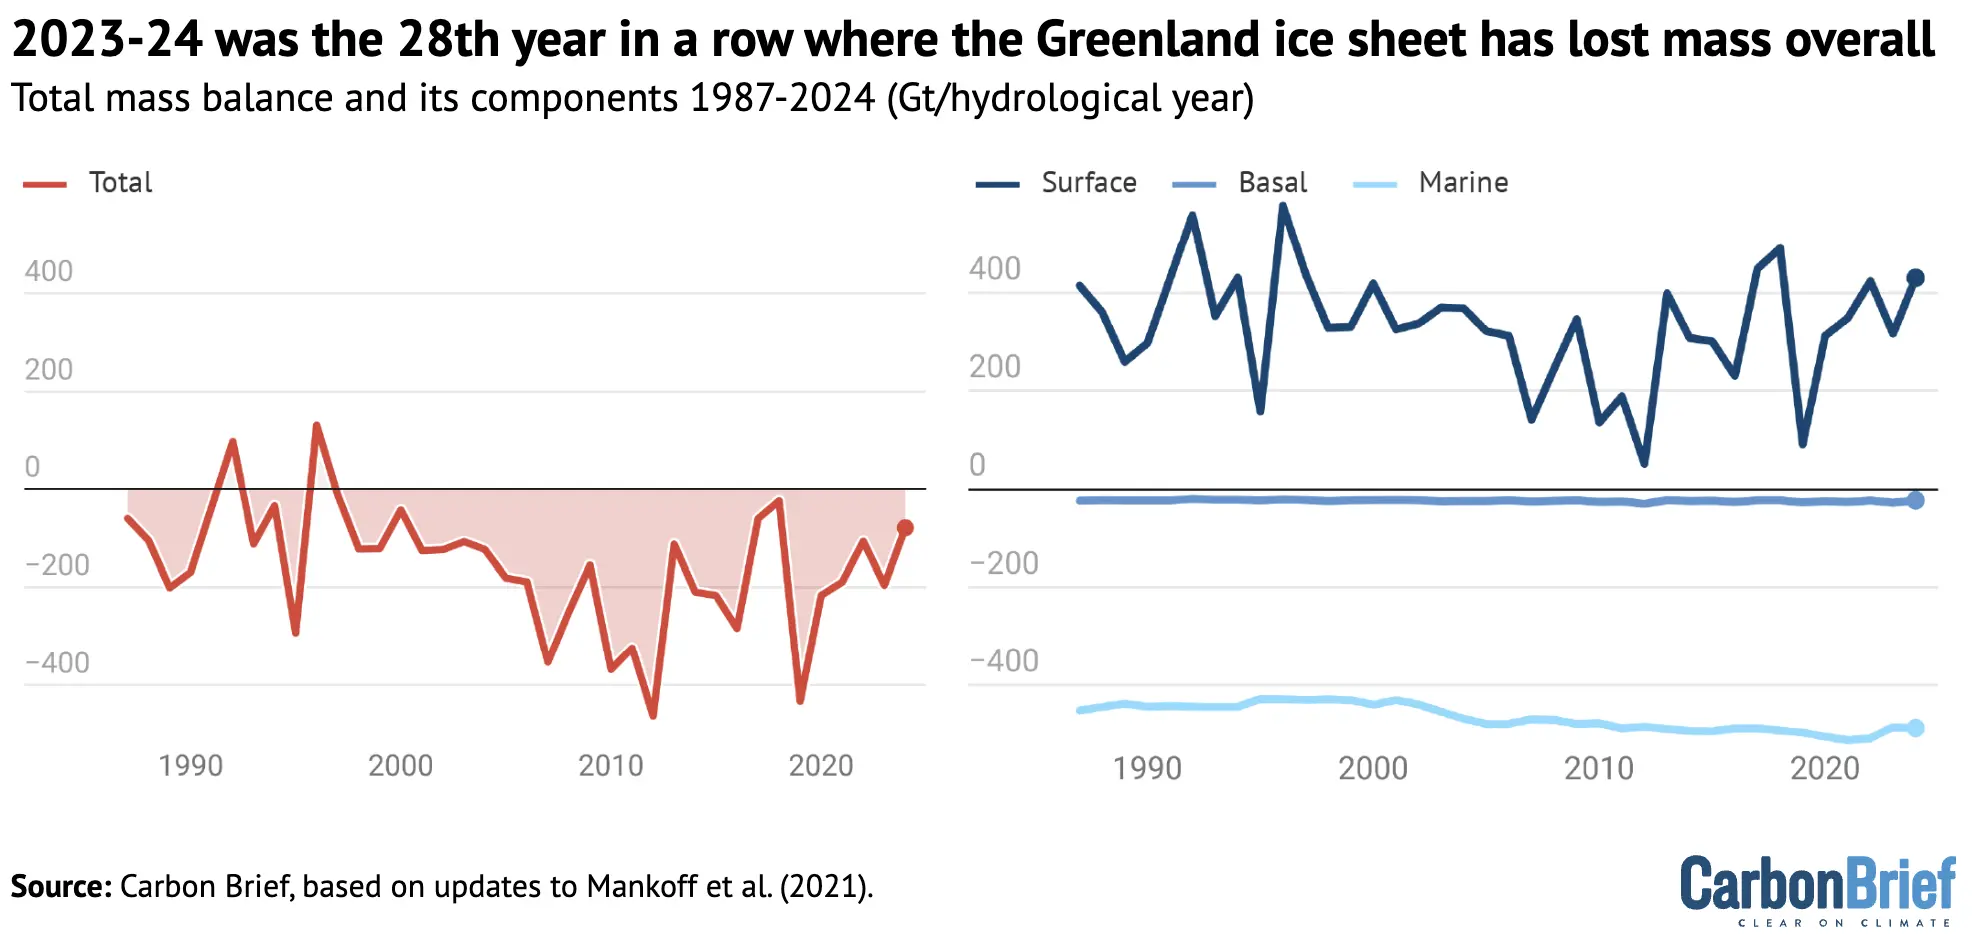 Chart showing the surface (blue), marine (green), basal (yellow) and total (red) mass balance for 1987 to 2024. Figures are in Gt per year. Based on updates to Mankoff et al. (2021)
Satellite data
Using data from the GRACE satellites, we can also estimate how much ice Greenland lost – independently from our calculations above.Â
The distance of these twin satellites changes slightly due to tiny gravity differences caused by mass changes. In addition, we can measure the speed at which ice flows through control points on the ice sheet where we know the thickness and shape of the ice. Thus, we can estimate MMB, the amount of ice being lost by the process of calving and submarine melting.Â
This data is openly available, allowing us to monitor the whole ice-sheet budget.
The map and graph below show the gain (blue) and loss (red) in the mass of ice. The difference in these mass changes over a glaciological year (September-August) is the TMB of the ice sheet for that particular year.
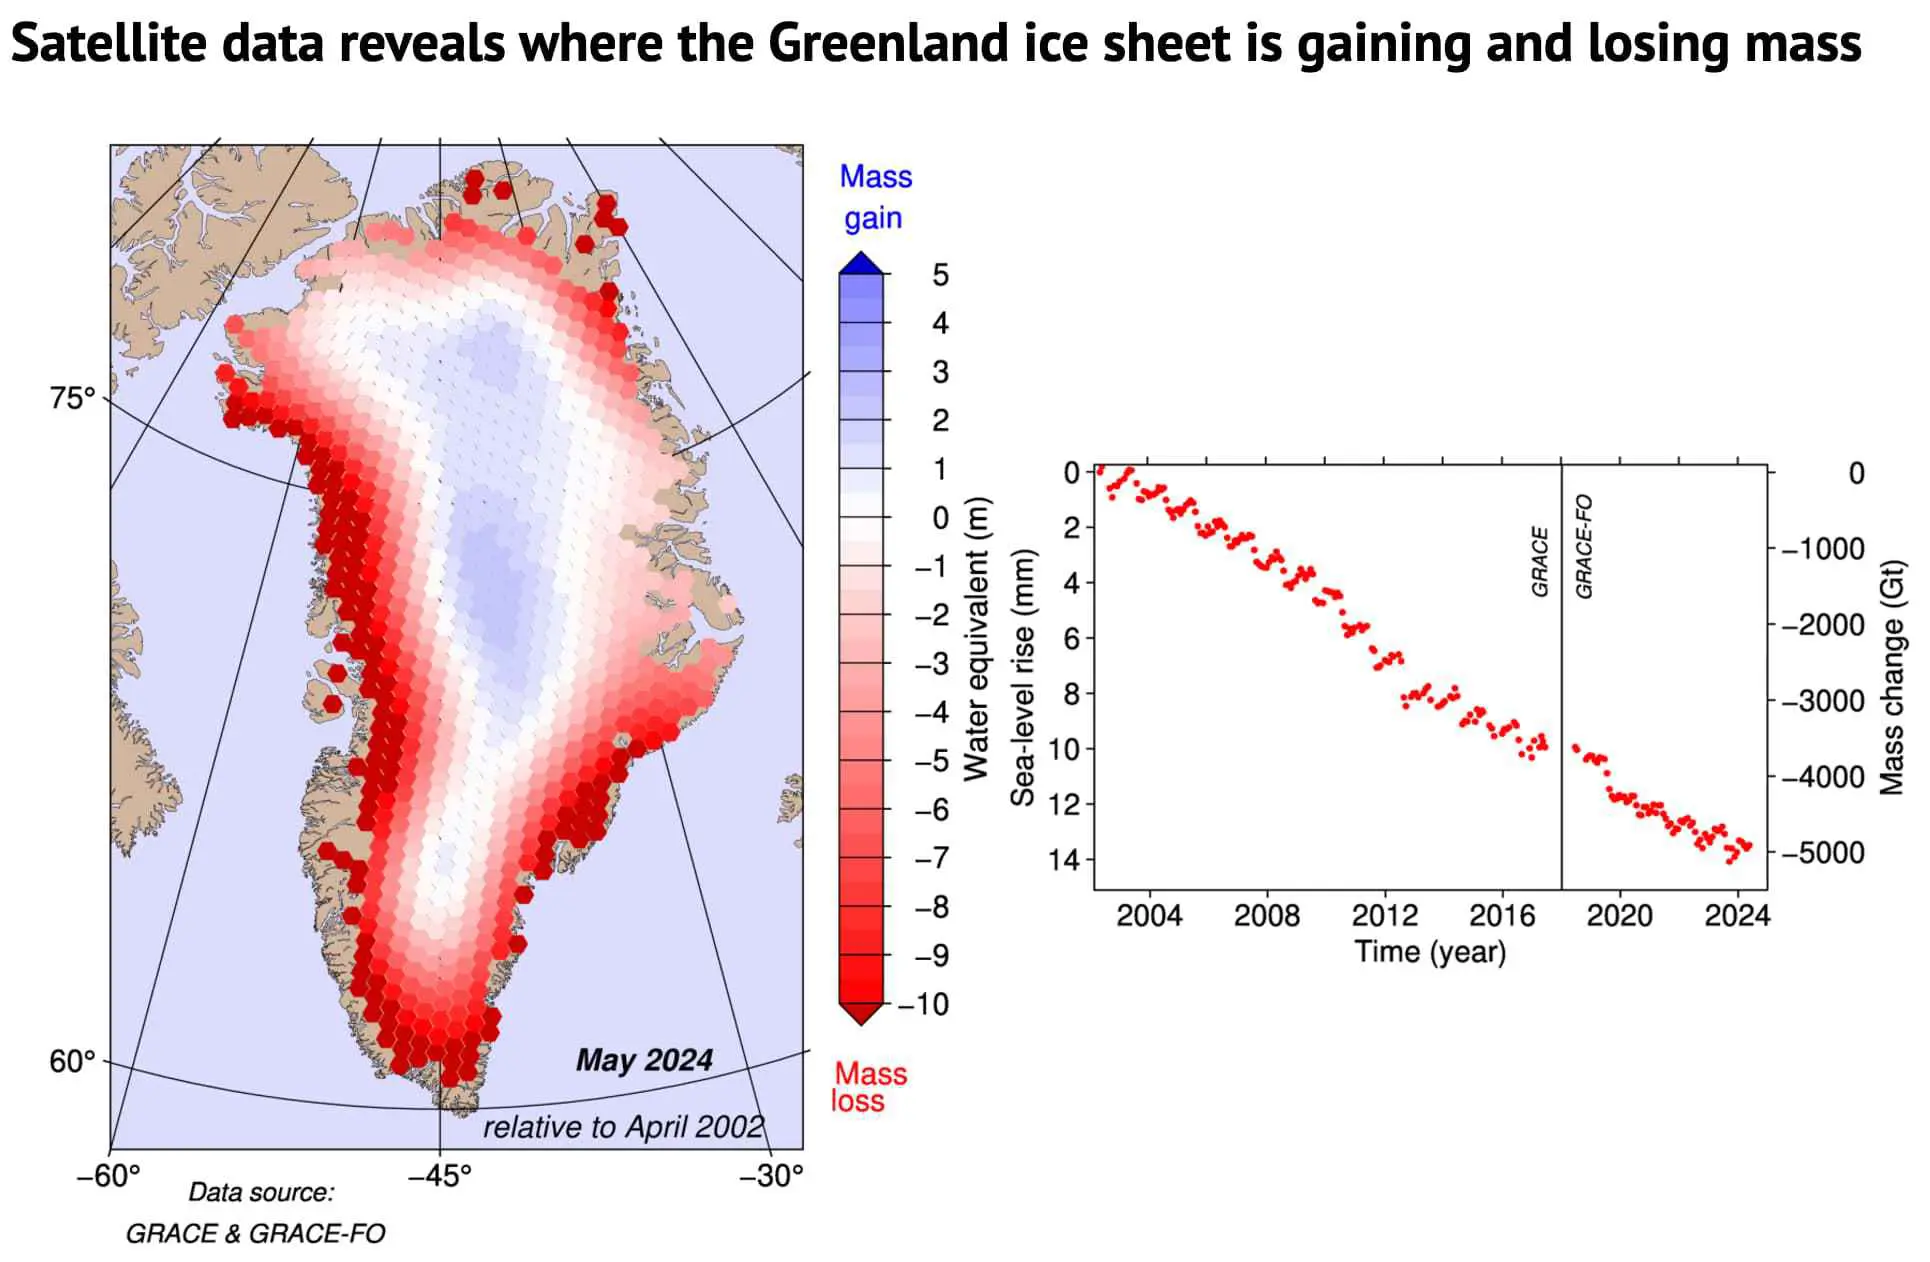 Gain and loss in the total mass of ice of the Greenland ice sheet based on the GRACE and GRACE-FO satellites, updated until May 2024. Both missions are twin satellites separated by a distance of around 220km. This distance depends on gravity and can be measured very precisely. Gravity changes in turn are related to mass changes for example due to the loss of ice. GRACE was launched in March 2002, and the mission ended in October 2017. GRACE-FO was launched in May 2018. Therefore a gap exists between both missions. Shown is the month-by-month mass change in billions of tonnes (Gt) = cubic kilometres (km3). Also shown is the corresponding contribution to sea level rise; 100Gt is equivalent to 0.28mm of global sea level rise. All changes are given relative to April 2002.
According to the GRACE satellite data, most of the ice loss over 2023-24 occurred along the edge of the ice sheet, in particular along the west coast. This is backed up both by PROMICE observations and model data. In the interior of Greenland, a small increase in ice mass is found, as there is usually little or no snow melt in this region.
The graph illustrates the month-by-month development in changes of mass measured in gigatonnes, relative to April 2002. The left axis on the graph shows how this ice mass loss translates into a sea level rise contribution, where 100Gt corresponds to 0.28mm of global sea level rise.
Our calculations and the GRACE satellite data are entirely independent ways of estimating Greenland’s TMB, yet the results are quite closely aligned. From April 2002 to May 2024, the ice sheet losses amounted to 4,756Gt (calculations) and 4,911Gt (satellites) of ice.
As 1Gt of water is equivalent to a cube of 1 km by 1 km by 1 km, 360 of these cubes is equivalent to 1mm of sea level rise averaged around the whole globe.
This means that, since 2002, the Greenland ice sheet alone has contributed around 14mm to global average sea level rise.
Sharelines from this story
Source link : http://www.bing.com/news/apiclick.aspx?ref=FexRss&aid=&tid=674606b5e4d84440a39d78abffaf3ae4&url=https%3A%2F%2Fwww.carbonbrief.org%2Fguest-post-how-the-greenland-ice-sheet-fared-in-2024%2F&c=12799092191589884930&mkt=en-us
Author :
Publish date : 2024-11-26 04:04:00
Copyright for syndicated content belongs to the linked Source.


