(Reference: imd.org)
A survey depicted the 15 indicators crucial for developing a smart city based on respondents worldwide.
Among the priority areas chosen by respondents, 72% preferred affordable housing, followed by fulfilling employment (52%), unemployment (50%), health services (34.4%), road congestion (29.7%), air population (26.8%), green spaces (26.5%), public transport (26.4%), school education (23.5%), Basic amenities (21.6%), citizen engagement (20.8%), recycling (20.5%), social mobility (18.7%), security (16.4%), and corruption (12.4%).
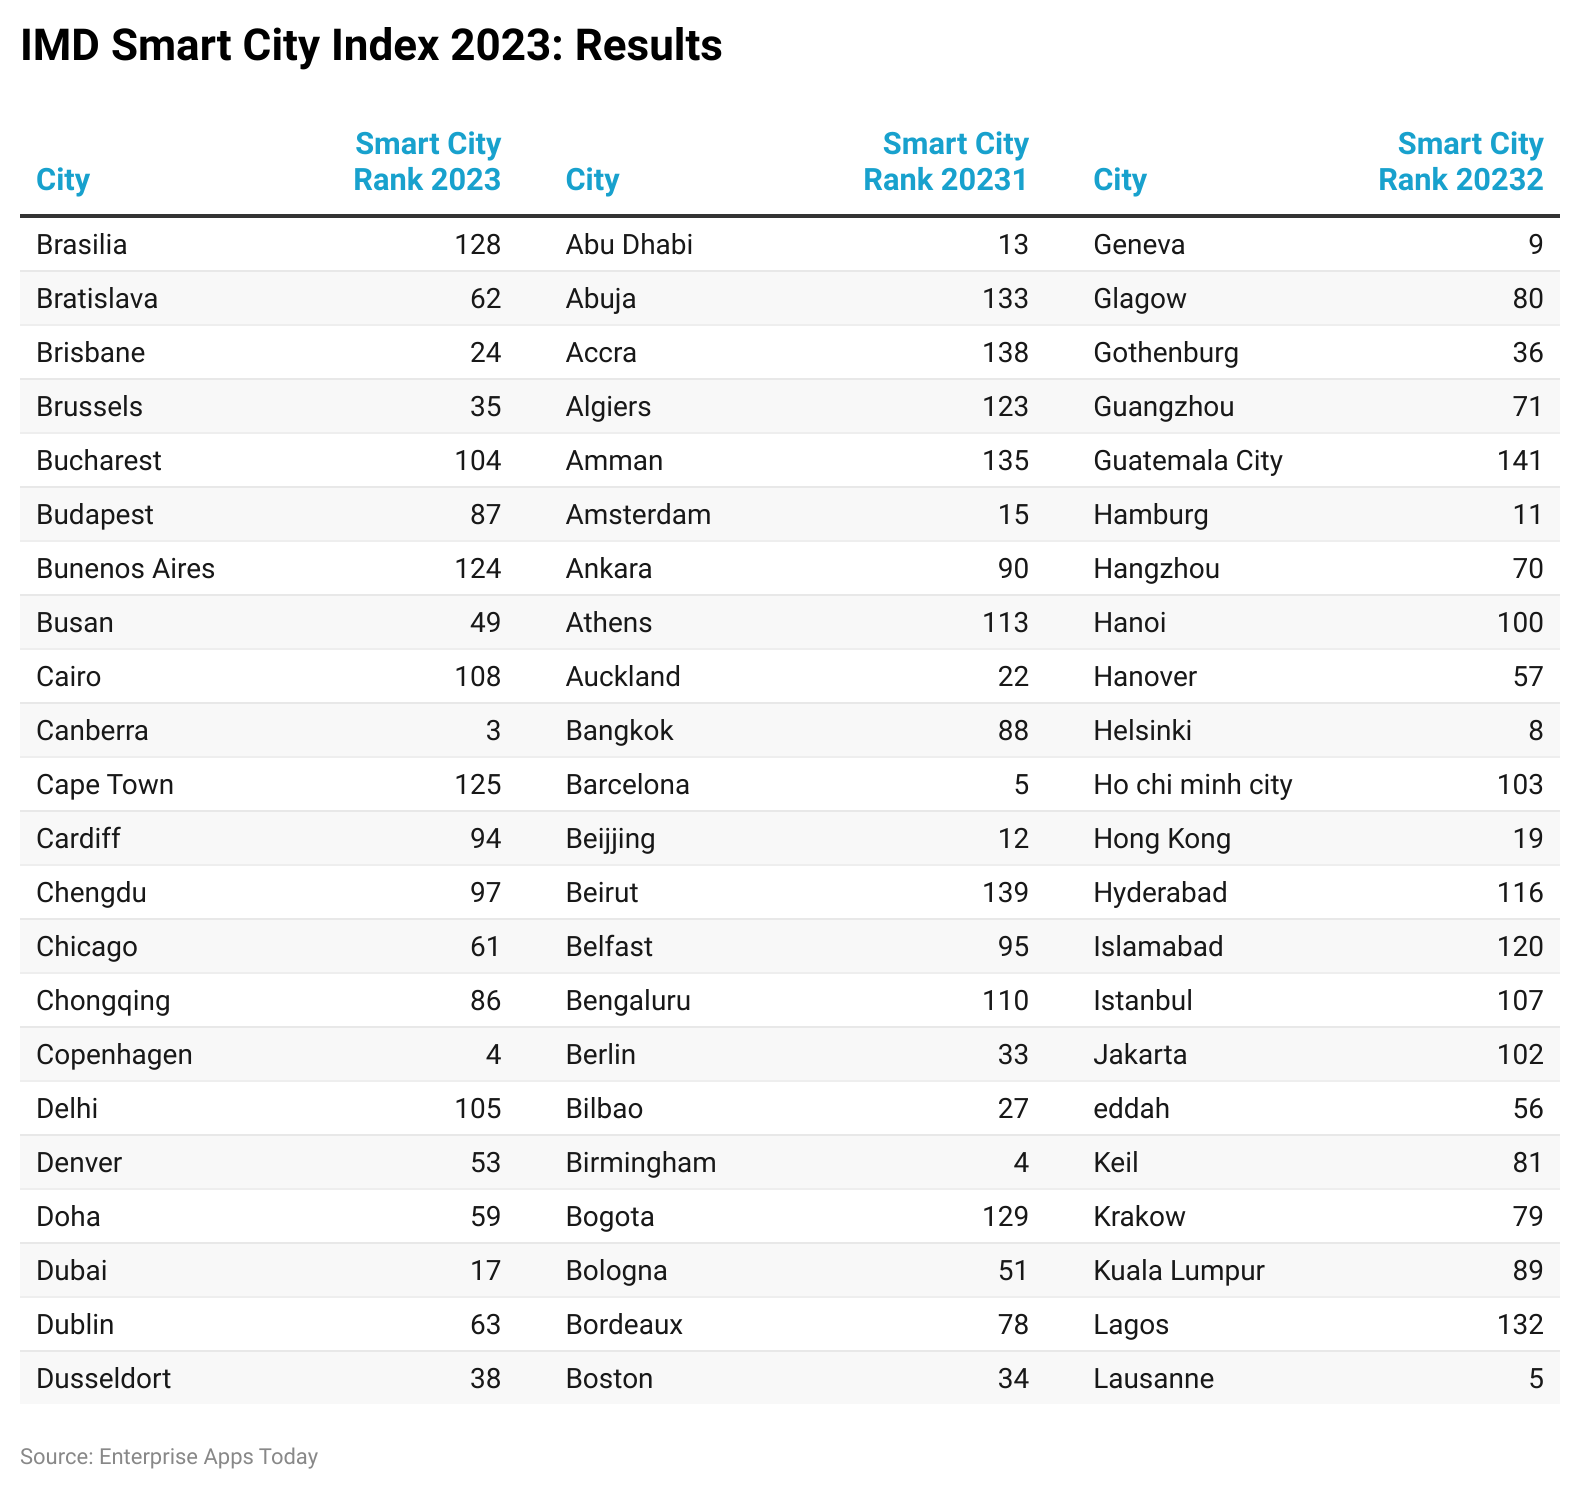
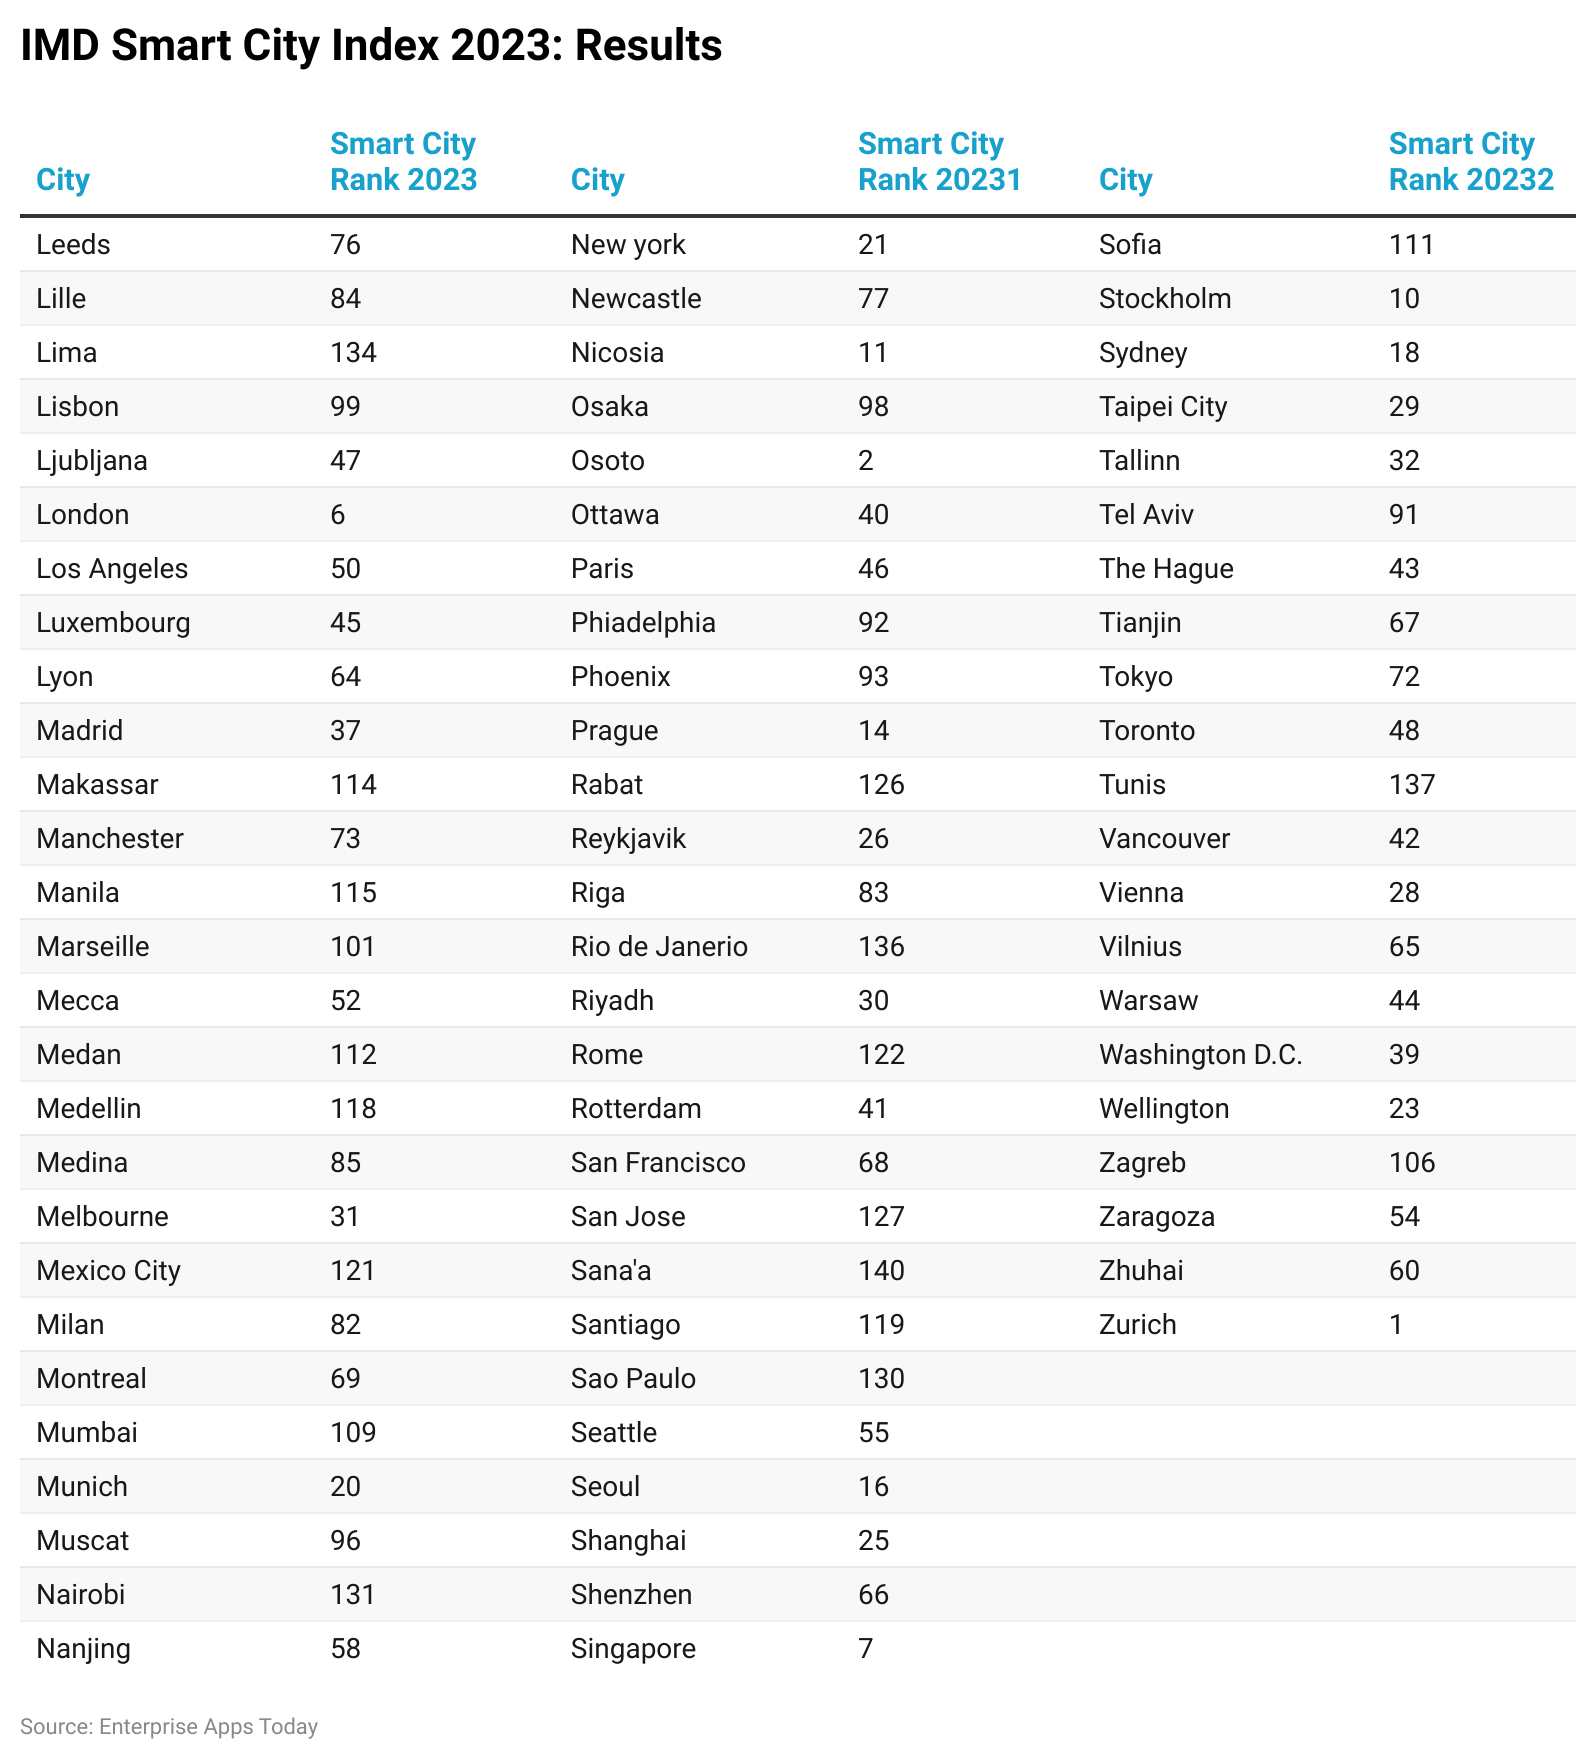
Smart City Statistics by Country Rank
(Reference: imd.cld.bz)
The IMD Smart City Index 2023 highlighted the smart city ranks globally.
Leading the smart city initiative are Zurich (1st), Oslo (2nd), Canberra (3rd), Copenhagen (4th), Lausanne (5th), London (6th), Singapore (7th), Helsinki (8th), Geneva (9th), and Stockholm (10th).
London, UK, sets itself apart with numerous 5G towers, green infrastructure, EV charging stations, and substantial investments in 6G, IoT, and AI for an advanced smart city.
New York boasts well-established tech-infused infrastructure, including water quality meters, sensors, and the deployment of LPWAN (Low-Power Wide Area Network) technologies.
France is home to important smart cities ﻗ Paris, Lille, Lyon, and Marseille.
Tokyo, Japan, showcases a broad range of smart cities with advanced tech systems like energy-efficient buildings, and comprehensive traffic management using cameras and sensors aiming for an 80% reduction in greenhouse gases by 2050.
Berlin, Germany, boasts energy-saving smart streetlights promoting sustainability and efficient transportation with plans for carbon neutrality by 2050.
Washington focuses on establishing a sustainable urban environment and driving economic development in 2023.
With an expected 47% of the population aged 65 and above by 2050, advanced digital healthcare systems cater to the needs of the elderly population.
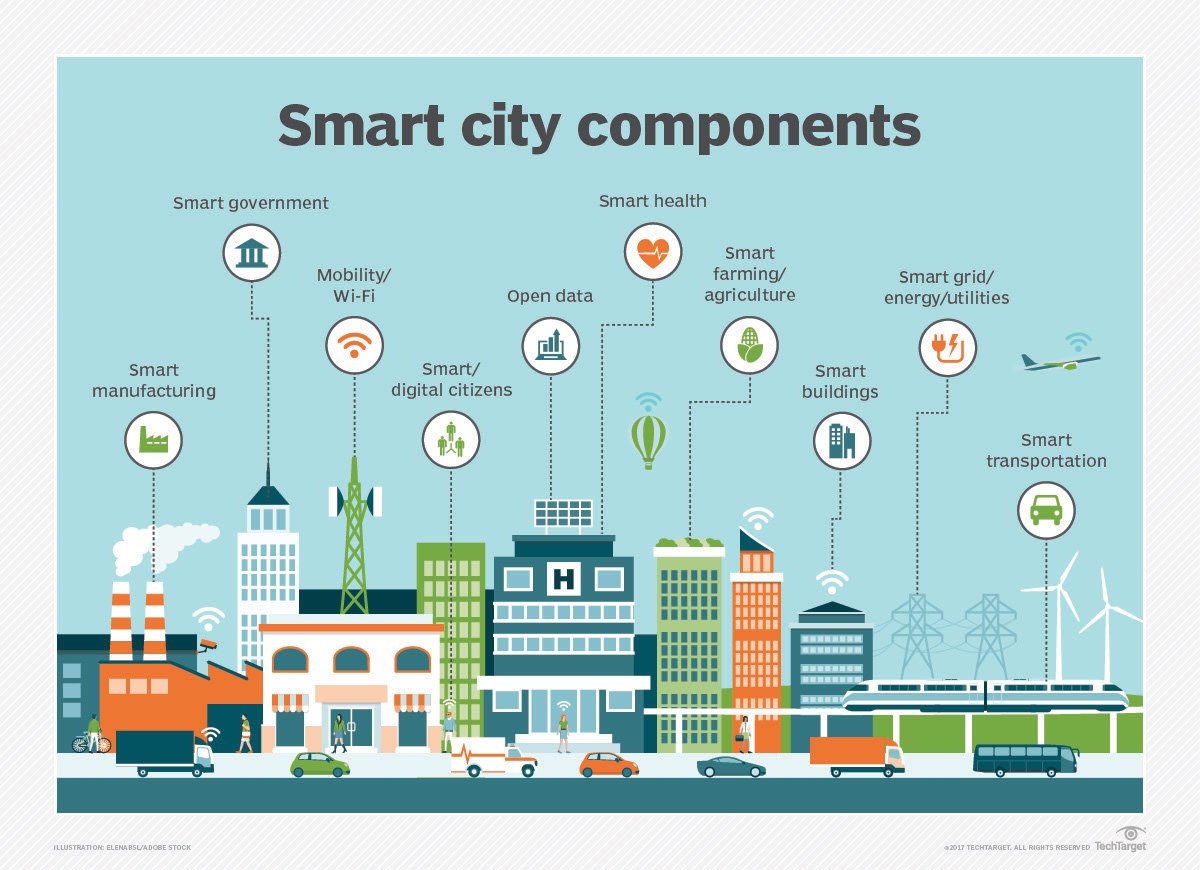
Components of Smart City
(Source: ttgtmedia.com)
The smart city market segments include governance and education (24.6%), smart security (13.5%), smart energy (15.8%), smart infrastructure (13.1%), smart mobility (8.7%), smart healthcare (14.6%), and smart building (9.7%).
Smart buildings integrate advanced sensors and systems for optimization and monitoring functions like Indoor Environmental Quality monitoring for weather, temperature, noise level, airflow, and energy efficiency.
Public safety and security measures feature predictive surveillance systems, advanced cameras, IoT sensors, and other devices.
Effective waste management trends in smart cities leverage MetTelﻗs IoT connectivity and single SIM for multi-area coverage.
Traffic streetlights primarily install low-power sensors and networks.
ﻗ CCTVs and buildings, etc.
ﻗ Smart Home Networks facilitate the secure sharing of home sensor data with neighbors, while also promoting and enhancing security services.
ﻗ Smart supply chain and logistics management is predominantly utilized by numerous companies and warehouses to track product shipments in real-time, ultimately reducing theft.
ﻗ Intelligent farming supports farmers in comprehending environmental factors through sensors that monitor nutrient levels, temperature, soil moisture, light intensity, and humidity.
Future Statistics of Smart City
ﻗ The projected AI market share in smart cities is set to reach $326 billion by 2028.
ﻗ Top 50 cities are expected to invest over $330 billion in implementing smart city technologies by 2025.
ﻗ By the end of 2025, the smart city market size in the Asian Pacific region is anticipated to lead with revenues estimated at $320 billion.
ﻗ According to Zipdo reports, the infrastructure and construction sector within smart cities is forecasted to reach $57.05 billion by 2027.
ﻗ The communication segment of smart cities is predicted to attain a market size of $377 billion by 2025.
ﻗ Canadaﻗs smart city growth rate is expected to reach a CAGR of 19.2% by 2024.
ﻗ The Chinese smart city technology market is anticipated to exceed $38 billion by the end of 2023.
ﻗ Developing nations are projected to account for 20% of the global smart cities market share by 2025.
Global Smart Home Statistics
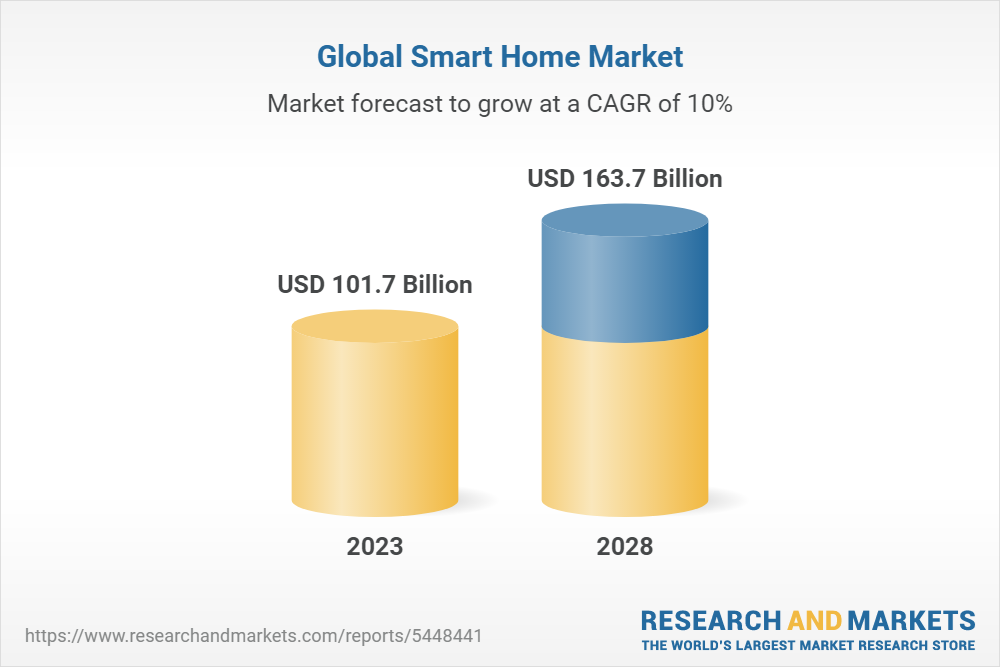
(Source: Market.us)
Global Smart Manufacturing Statistics
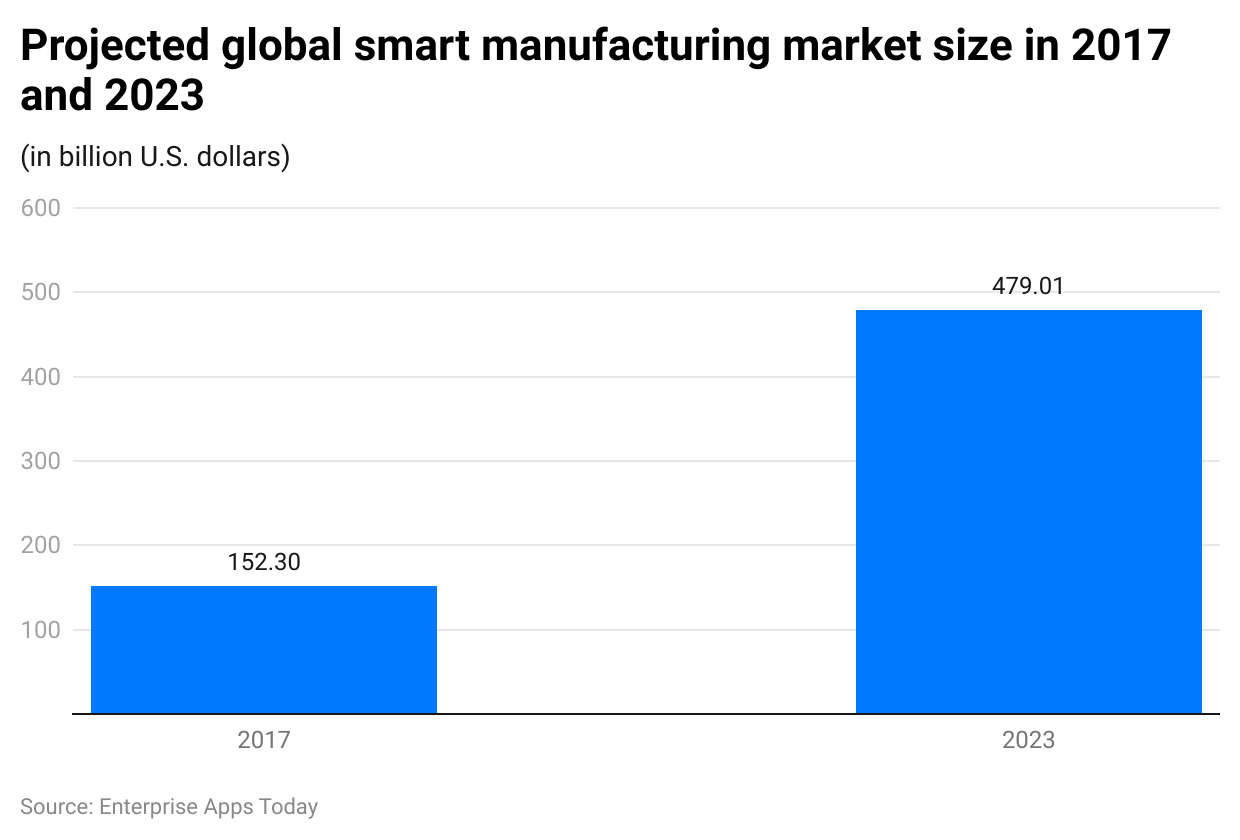
(Reference: statista.com)
Statista predicts that the smart manufacturing market size will reach $480 billion by 2023, with a CAGR of 12.3% from 2023 to 2027.
Global Smart Government Statistics
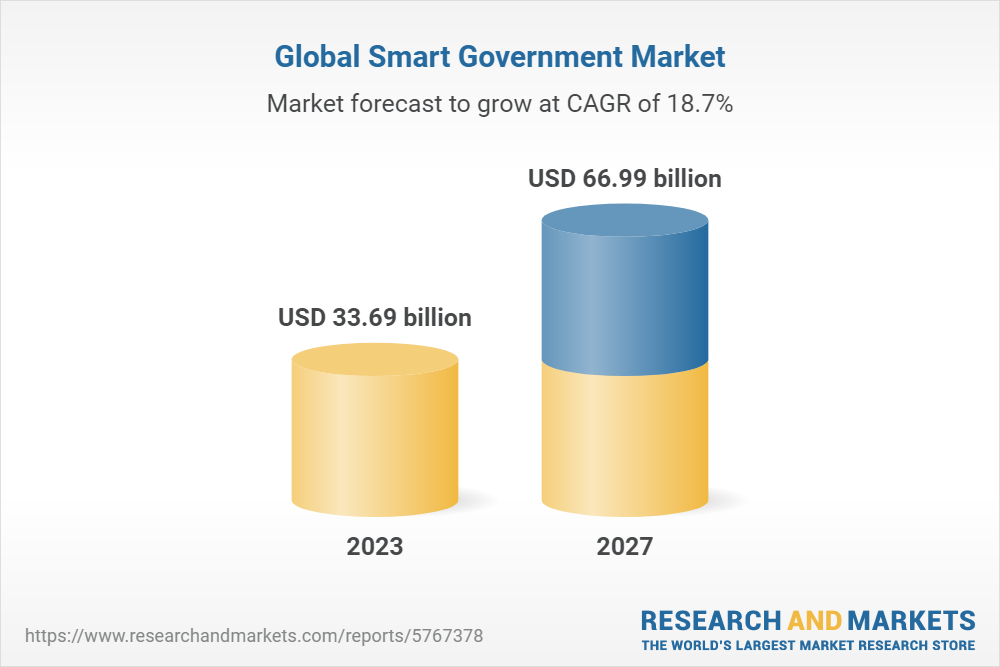
(Source: researchandmarkets.com)
Research and Markets reports that the global smart government market is expected to reach $33.69 billion in 2023 and is forecasted to reach $66.99 billion by the end of 2027, with a CAGR of 18.7%.
Global Smart Transportation Statistics
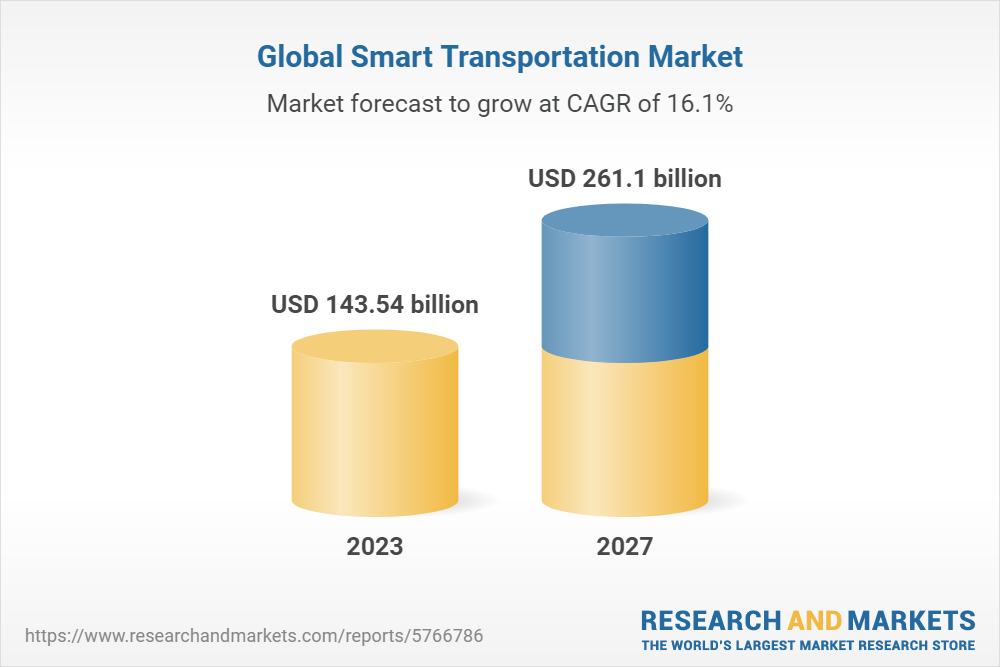
(Source: researchandmarkets.com)
The global smart transportation market is predicted to reach $143.54 billion by 2023 and is projected to amount to $261.1 billion by 2027, with a CAGR of 16.1%.
Global Smart Agriculture Statistics
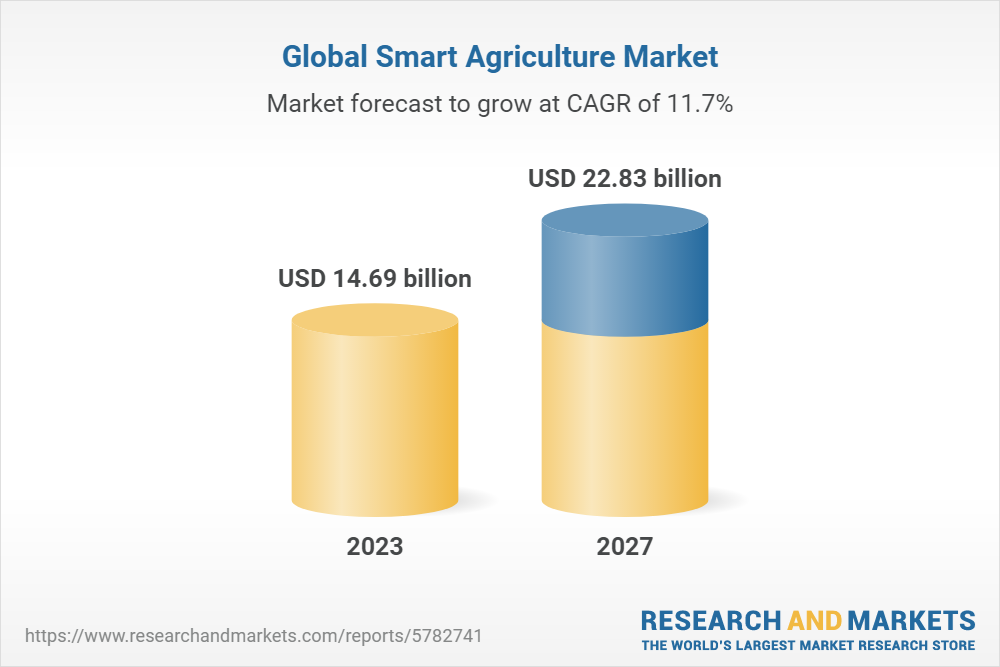
(Source: researchandmarkets.com)
The global smart agriculture market is projected to reach $14.69 billion by 2023 and is expected to hit $22.83 billion by 2027, with a CAGR of 11.7%.
Conclusion
Upon completion of this article on Smart City Statistics, it is evident that this concept has enhanced infrastructure integration with advanced technologies, leading to improved connectivity, manufacturing processes, efficient transportation, waste management systems, modern governance, and surveillance. The comprehensive statistics provided in this article offer valuable insights into the subject matter.
[3px] border-t-[3px] p-4 border-[#1d598f] my-4″ style=”box-shadow: 0 0 14px rgb(9 38 66 / 8%);”>
Sources
Who discovered the smart city?
In 2007, the smart city was first coined by IBM and Cisco to emphasize the roles of technology in making cost-effective, efficient, and sustainable cities.
When was the first smart city made?
In the year 1994, it is said that Amsterdam is termed as the first virtual digital city to be created.
What are the pillars of smart cities?
Important pillars of smart cities are telecommunications, technology and innovation, transportation and mobility, finance, investment and economic development, government leadership and public policy, energy, etc.
Which is the no.1 smart city in India?
As of 25th August 2023 reports, Indore has secured the record of top smart city in India and has received the National Smart City Award.
When can a city be called a smart city?
A city that includes advanced implementation of new technologies and urban developmentﻗs such as reduced CO2 emission, improved energy efficiency, and increased citizensﻗ well-being.
Smart City Statistics 2023 By Companies, Market Share, Prioritized Areas and Country Rank
Data is from 2023 and 2024 and forecast data is for 2025 and 2026. We also expand the forecast data to 2027 and 2028.
——
REFERENCES:
This information was taken from various sources around the world, including these countries:
Australia, Canada, USA, UK, UAE, India, Pakistan, Philippines, Indonesia, Nigeria, Tanzania, Kenya, US, United Kingdom, United States of America, Malaysia, U.S., South Africa, New Zealand, Turkey, United Arab Emirates.
Afghanistan, Albania, Algeria, American Samoa, Andorra, Angola, Anguilla, Antarctica, Antigua and Barbuda, Argentina, Armenia, Aruba, Australia, Austria, Azerbaijan.
Bahamas, Bahrain, Bangladesh, Barbados, Belarus, Belgium, Belize, Benin, Bermuda, Bhutan, Bolivia, Bosnia and Herzegovina, Botswana, Bouvet Island, Brazil, British Indian Ocean Territory, Brunei Darussalam, Bulgaria, Burkina Faso, Burundi.
Cambodia, Cameroon, Canada, Cape Verde, Cayman Islands, Central African Republic, Chad, Chile, China, Christmas Island, Cocos (Keeling Islands), Colombia, Comoros, Congo, Cook Islands, Costa Rica, Cote DﻗIvoire (Ivory Coast), Croatia (Hrvatska), Cuba, Cyprus, Czech Republic.
Denmark, Djibouti, Dominica, Dominican Republic, East Timor, Ecuador, Egypt, El Salvador, Equatorial Guinea, Eritrea, Estonia, Ethiopia, Falkland Islands (Malvinas), Faroe Islands, Fiji, Finland, France, Metropolitan, French Guiana, French Polynesia, French Southern Territories.
Gabon, Gambia, Georgia, Germany, Ghana, Gibraltar, Greece, Greenland, Grenada, Guadeloupe, Guam, Guatemala, Guinea, Guinea-Bissau, Guyana, Haiti, Heard and McDonald Islands, Honduras, Hong Kong, Hungary, Iceland, India, Indonesia, Iran, Iraq, Ireland, Israel, Italy.
Jamaica, Japan, Jordan, Kazakhstan, Kenya, Kiribati, North Korea, South Korea, Kuwait, Kyrgyzstan, Laos, Latvia, Lebanon, Lesotho, Liberia, Libya, Liechtenstein, Lithuania, Luxembourg.
Macau, Macedonia, Madagascar, Malawi, Malaysia, Maldives, Mali, Malta, Marshall Islands, Martinique, Mauritania, Mauritius, Mayotte, Mexico, Micronesia, Moldova, Monaco, Mongolia, Montserrat, Morocco, Mozambique, Myanmar.
Namibia, Nauru, Nepal, Netherlands, Netherlands Antilles, New Caledonia, New Zealand (NZ), Nicaragua, Niger, Nigeria, Niue, Norfolk Island, Northern Mariana Islands, Norway.
Oman, Pakistan, Palau, Panama, Papua New Guinea, Paraguay, Peru, Philippines, Pitcairn, Poland, Portugal, Puerto Rico, Qatar, Reunion, Romania, Russia, Rwanda, Saint Kitts and Nevis, Saint Lucia, Saint Vincent and The Grenadines, Samoa, San Marino, Sao Tome and Principe.
Saudi Arabia, Senegal, Serbia, Seychelles, Sierra Leone, Singapore, Slovakia, Slovenia, Solomon Islands, Somalia, South Africa, South Georgia and South Sandwich Islands, Spain, Sri Lanka, St. Helena, St. Pierre and Miquelon, Sudan, Suriname, Svalbard and Jan Mayen Islands, Swaziland, Sweden, Switzerland, Syria.
Taiwan, Tajikistan, Tanzania, Thailand, Togo, Tokelau, Tonga, Trinidad and Tobago, Tunisia, Turkey, Turkmenistan, Turks and Caicos Islands, Tuvalu, Uganda, Ukraine, United Arab Emirates (UAE), UK (United Kingdom), USA (United States of America, U.S.), US Minor Outlying Islands.
Uruguay, Uzbekistan, Vanuatu, Vatican City State (Holy See), Venezuela, Vietnam, Virgin Islands (British), Virgin Islands (US), Wallis and Futuna Islands, Western Sahara, Yemen, Yugoslavia, Zaire, Zambia, Zimbabwe.
Smart City Statistics 2023 By Companies, Market Share, Prioritized Areas and Country Rank
August 22, 2024
Source link : http://www.bing.com/news/apiclick.aspx?ref=FexRss&aid=&tid=66cf0bb374b943f3b9d8938ec086a94e&url=https%3A%2F%2Fhollywoodgazette.com%2Fsmart-city-statistics-html%2F&c=16777471521887890804&mkt=en-us
Author :
Publish date : 2024-08-27 22:29:00
Copyright for syndicated content belongs to the linked Source.


