
Where immigrants have settled in the U.S. over time
1840-1889
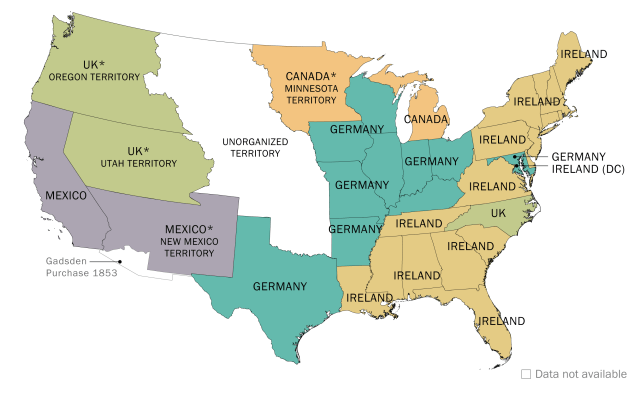
The first large wave of immigration to the U.S. began in the 1840s and lasted until 1889. During this time, more than 14 million immigrants came to the country. Most arrived from Northern or Western Europe; Germany, Ireland and the United Kingdom alone accounted for 70% of the new arrivals.
1850
Top five foreign-born populations by country of origin (in millions)
Total U.S. population 23.2 million
Total foreign born 2.2 million
Percentage foreign born 9.7%
Note: Populations rounded to nearest 10,000. Shares and ranks based on unrounded numbers. Germany includes East and West Germany (1980-1990), German states coded by IPUMS (1850-1940). Alsace and Lorraine are part of Germany for 1870-1910 and France in other years. United Kingdom (UK) includes England, Scotland, Wales and Channel Islands in all years and Northern Ireland in 1930 and later. China includes Mongolia and Taiwan for 1850-1940; Hong Kong and Macau for 2000 and later. Poland includes areas designated as Poland by IPUMS (1850-1940) including “Austrian,” “German,” “Prussian” and “Russian” Poland. The term “Russia” is used for 1850-1920, “USSR” for 1930-1990 and “USSR (former)” for 2000 and later. These areas encompass all former republics of the USSR including Baltic states in all years. The only exception is Armenia which is coded separately in 1930-1940. Various other areas have been grouped together but do not appear in the top five countries for the U.S.
Source: U.S. Census Bureau, “Historical Census Statistics on the Foreign-Born Population of the United States: 1850-2000”; Pew Research Center tabulations of complete count census data for 1850-1940; census samples for 1950 (1%), 1960, 1980-2000 (5%) and 1970 (1% form 1); 2010 and 2022 American Community Survey (1%). Alaska and Hawaii from samples for 1900-1920 (1%) and 1930 (5%). All data from IPUMS.
1860
Top five foreign-born populations by country of origin (in millions)
Total U.S. population 31.4 million
Total foreign born 4.1 million
Percentage foreign born 13.2%
Note: Populations rounded to nearest 10,000. Shares and ranks based on unrounded numbers. Germany includes East and West Germany (1980-1990), German states coded by IPUMS (1850-1940). Alsace and Lorraine are part of Germany for 1870-1910 and France in other years. United Kingdom (UK) includes England, Scotland, Wales and Channel Islands in all years and Northern Ireland in 1930 and later. China includes Mongolia and Taiwan for 1850-1940; Hong Kong and Macau for 2000 and later. Poland includes areas designated as Poland by IPUMS (1850-1940) including “Austrian,” “German,” “Prussian” and “Russian” Poland. The term “Russia” is used for 1850-1920, “USSR” for 1930-1990 and “USSR (former)” for 2000 and later. These areas encompass all former republics of the USSR including Baltic states in all years. The only exception is Armenia which is coded separately in 1930-1940. Various other areas have been grouped together but do not appear in the top five countries for the U.S.
Source: U.S. Census Bureau, “Historical Census Statistics on the Foreign-Born Population of the United States: 1850-2000”; Pew Research Center tabulations of complete count census data for 1850-1940; census samples for 1950 (1%), 1960, 1980-2000 (5%) and 1970 (1% form 1); 2010 and 2022 American Community Survey (1%). Alaska and Hawaii from samples for 1900-1920 (1%) and 1930 (5%). All data from IPUMS.
1870
Top five foreign-born populations by country of origin (in millions)
Total U.S. population 38.6 million
Total foreign born 5.6 million
Percentage foreign born 14.4%
Note: Populations rounded to nearest 10,000. Shares and ranks based on unrounded numbers. Germany includes East and West Germany (1980-1990), German states coded by IPUMS (1850-1940). Alsace and Lorraine are part of Germany for 1870-1910 and France in other years. United Kingdom (UK) includes England, Scotland, Wales and Channel Islands in all years and Northern Ireland in 1930 and later. China includes Mongolia and Taiwan for 1850-1940; Hong Kong and Macau for 2000 and later. Poland includes areas designated as Poland by IPUMS (1850-1940) including “Austrian,” “German,” “Prussian” and “Russian” Poland. The term “Russia” is used for 1850-1920, “USSR” for 1930-1990 and “USSR (former)” for 2000 and later. These areas encompass all former republics of the USSR including Baltic states in all years. The only exception is Armenia which is coded separately in 1930-1940. Various other areas have been grouped together but do not appear in the top five countries for the U.S.
Source: U.S. Census Bureau, “Historical Census Statistics on the Foreign-Born Population of the United States: 1850-2000”; Pew Research Center tabulations of complete count census data for 1850-1940; census samples for 1950 (1%), 1960, 1980-2000 (5%) and 1970 (1% form 1); 2010 and 2022 American Community Survey (1%). Alaska and Hawaii from samples for 1900-1920 (1%) and 1930 (5%). All data from IPUMS.
1880
Top five foreign-born populations by country of origin (in millions)
Total U.S. population 50.2 million
Total foreign born 6.7 million
Percentage foreign born 13.3%
Note: Populations rounded to nearest 10,000. Shares and ranks based on unrounded numbers. Germany includes East and West Germany (1980-1990), German states coded by IPUMS (1850-1940). Alsace and Lorraine are part of Germany for 1870-1910 and France in other years. United Kingdom (UK) includes England, Scotland, Wales and Channel Islands in all years and Northern Ireland in 1930 and later. China includes Mongolia and Taiwan for 1850-1940; Hong Kong and Macau for 2000 and later. Poland includes areas designated as Poland by IPUMS (1850-1940) including “Austrian,” “German,” “Prussian” and “Russian” Poland. The term “Russia” is used for 1850-1920, “USSR” for 1930-1990 and “USSR (former)” for 2000 and later. These areas encompass all former republics of the USSR including Baltic states in all years. The only exception is Armenia which is coded separately in 1930-1940. Various other areas have been grouped together but do not appear in the top five countries for the U.S.
Source: U.S. Census Bureau, “Historical Census Statistics on the Foreign-Born Population of the United States: 1850-2000”; Pew Research Center tabulations of complete count census data for 1850-1940; census samples for 1950 (1%), 1960, 1980-2000 (5%) and 1970 (1% form 1); 2010 and 2022 American Community Survey (1%). Alaska and Hawaii from samples for 1900-1920 (1%) and 1930 (5%). All data from IPUMS.
1890
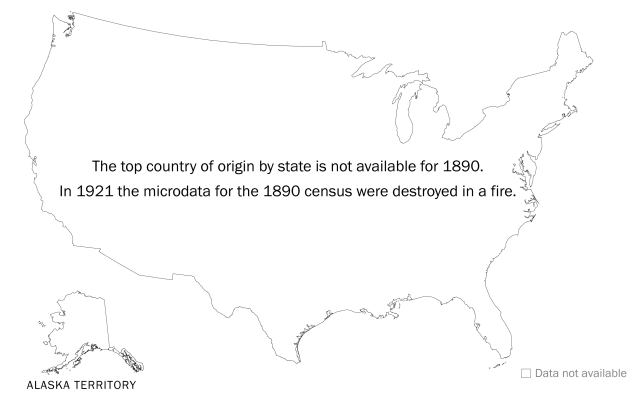
Top five foreign-born populations by country of origin (in millions)
Total U.S. population 62.6 million
Total foreign born 9.3 million
Percentage foreign born 14.8%
Note: Populations rounded to nearest 10,000. Shares and ranks based on unrounded numbers. Germany includes East and West Germany (1980-1990), German states coded by IPUMS (1850-1940). Alsace and Lorraine are part of Germany for 1870-1910 and France in other years. United Kingdom (UK) includes England, Scotland, Wales and Channel Islands in all years and Northern Ireland in 1930 and later. China includes Mongolia and Taiwan for 1850-1940; Hong Kong and Macau for 2000 and later. Poland includes areas designated as Poland by IPUMS (1850-1940) including “Austrian,” “German,” “Prussian” and “Russian” Poland. The term “Russia” is used for 1850-1920, “USSR” for 1930-1990 and “USSR (former)” for 2000 and later. These areas encompass all former republics of the USSR including Baltic states in all years. The only exception is Armenia which is coded separately in 1930-1940. Various other areas have been grouped together but do not appear in the top five countries for the U.S.
Source: U.S. Census Bureau, “Historical Census Statistics on the Foreign-Born Population of the United States: 1850-2000”; Pew Research Center tabulations of complete count census data for 1850-1940; census samples for 1950 (1%), 1960, 1980-2000 (5%) and 1970 (1% form 1); 2010 and 2022 American Community Survey (1%). Alaska and Hawaii from samples for 1900-1920 (1%) and 1930 (5%). All data from IPUMS.
1900

Top five foreign-born populations by country of origin (in millions)
Total U.S. population 76.0 million
Total foreign born 10.3 million
Percentage foreign born 13.6%
Note: Populations rounded to nearest 10,000. Shares and ranks based on unrounded numbers. Germany includes East and West Germany (1980-1990), German states coded by IPUMS (1850-1940). Alsace and Lorraine are part of Germany for 1870-1910 and France in other years. United Kingdom (UK) includes England, Scotland, Wales and Channel Islands in all years and Northern Ireland in 1930 and later. China includes Mongolia and Taiwan for 1850-1940; Hong Kong and Macau for 2000 and later. Poland includes areas designated as Poland by IPUMS (1850-1940) including “Austrian,” “German,” “Prussian” and “Russian” Poland. The term “Russia” is used for 1850-1920, “USSR” for 1930-1990 and “USSR (former)” for 2000 and later. These areas encompass all former republics of the USSR including Baltic states in all years. The only exception is Armenia which is coded separately in 1930-1940. Various other areas have been grouped together but do not appear in the top five countries for the U.S.
Source: U.S. Census Bureau, “Historical Census Statistics on the Foreign-Born Population of the United States: 1850-2000”; Pew Research Center tabulations of complete count census data for 1850-1940; census samples for 1950 (1%), 1960, 1980-2000 (5%) and 1970 (1% form 1); 2010 and 2022 American Community Survey (1%). Alaska and Hawaii from samples for 1900-1920 (1%) and 1930 (5%). All data from IPUMS.
1910
Top five foreign-born populations by country of origin (in millions)
Total U.S. population 92.0 million
Total foreign born 13.5 million
Percentage foreign born 14.7%
Note: Populations rounded to nearest 10,000. Shares and ranks based on unrounded numbers. Germany includes East and West Germany (1980-1990), German states coded by IPUMS (1850-1940). Alsace and Lorraine are part of Germany for 1870-1910 and France in other years. United Kingdom (UK) includes England, Scotland, Wales and Channel Islands in all years and Northern Ireland in 1930 and later. China includes Mongolia and Taiwan for 1850-1940; Hong Kong and Macau for 2000 and later. Poland includes areas designated as Poland by IPUMS (1850-1940) including “Austrian,” “German,” “Prussian” and “Russian” Poland. The term “Russia” is used for 1850-1920, “USSR” for 1930-1990 and “USSR (former)” for 2000 and later. These areas encompass all former republics of the USSR including Baltic states in all years. The only exception is Armenia which is coded separately in 1930-1940. Various other areas have been grouped together but do not appear in the top five countries for the U.S.
Source: U.S. Census Bureau, “Historical Census Statistics on the Foreign-Born Population of the United States: 1850-2000”; Pew Research Center tabulations of complete count census data for 1850-1940; census samples for 1950 (1%), 1960, 1980-2000 (5%) and 1970 (1% form 1); 2010 and 2022 American Community Survey (1%). Alaska and Hawaii from samples for 1900-1920 (1%) and 1930 (5%). All data from IPUMS.
1920
Top five foreign-born populations by country of origin (in millions)
Total U.S. population 105.7 million
Total foreign born 13.9 million
Percentage foreign born 13.2%
Note: Populations rounded to nearest 10,000. Shares and ranks based on unrounded numbers. Germany includes East and West Germany (1980-1990), German states coded by IPUMS (1850-1940). Alsace and Lorraine are part of Germany for 1870-1910 and France in other years. United Kingdom (UK) includes England, Scotland, Wales and Channel Islands in all years and Northern Ireland in 1930 and later. China includes Mongolia and Taiwan for 1850-1940; Hong Kong and Macau for 2000 and later. Poland includes areas designated as Poland by IPUMS (1850-1940) including “Austrian,” “German,” “Prussian” and “Russian” Poland. The term “Russia” is used for 1850-1920, “USSR” for 1930-1990 and “USSR (former)” for 2000 and later. These areas encompass all former republics of the USSR including Baltic states in all years. The only exception is Armenia which is coded separately in 1930-1940. Various other areas have been grouped together but do not appear in the top five countries for the U.S.
Source: U.S. Census Bureau, “Historical Census Statistics on the Foreign-Born Population of the United States: 1850-2000”; Pew Research Center tabulations of complete count census data for 1850-1940; census samples for 1950 (1%), 1960, 1980-2000 (5%) and 1970 (1% form 1); 2010 and 2022 American Community Survey (1%). Alaska and Hawaii from samples for 1900-1920 (1%) and 1930 (5%). All data from IPUMS.
1930
Top five foreign-born populations by country of origin (in millions)
Total U.S. population 122.8 million
Total foreign born 14.2 million
Percentage foreign born 11.6%
Note: Populations rounded to nearest 10,000. Shares and ranks based on unrounded numbers. Germany includes East and West Germany (1980-1990), German states coded by IPUMS (1850-1940). Alsace and Lorraine are part of Germany for 1870-1910 and France in other years. United Kingdom (UK) includes England, Scotland, Wales and Channel Islands in all years and Northern Ireland in 1930 and later. China includes Mongolia and Taiwan for 1850-1940; Hong Kong and Macau for 2000 and later. Poland includes areas designated as Poland by IPUMS (1850-1940) including “Austrian,” “German,” “Prussian” and “Russian” Poland. The term “Russia” is used for 1850-1920, “USSR” for 1930-1990 and “USSR (former)” for 2000 and later. These areas encompass all former republics of the USSR including Baltic states in all years. The only exception is Armenia which is coded separately in 1930-1940. Various other areas have been grouped together but do not appear in the top five countries for the U.S.
Source: U.S. Census Bureau, “Historical Census Statistics on the Foreign-Born Population of the United States: 1850-2000”; Pew Research Center tabulations of complete count census data for 1850-1940; census samples for 1950 (1%), 1960, 1980-2000 (5%) and 1970 (1% form 1); 2010 and 2022 American Community Survey (1%). Alaska and Hawaii from samples for 1900-1920 (1%) and 1930 (5%). All data from IPUMS.
1940
Top five foreign-born populations by country of origin (in millions)
Total U.S. population 131.7 million
Total foreign born 11.6 million
Percentage foreign born 8.8%
Note: Populations rounded to nearest 10,000. Shares and ranks based on unrounded numbers. Germany includes East and West Germany (1980-1990), German states coded by IPUMS (1850-1940). Alsace and Lorraine are part of Germany for 1870-1910 and France in other years. United Kingdom (UK) includes England, Scotland, Wales and Channel Islands in all years and Northern Ireland in 1930 and later. China includes Mongolia and Taiwan for 1850-1940; Hong Kong and Macau for 2000 and later. Poland includes areas designated as Poland by IPUMS (1850-1940) including “Austrian,” “German,” “Prussian” and “Russian” Poland. The term “Russia” is used for 1850-1920, “USSR” for 1930-1990 and “USSR (former)” for 2000 and later. These areas encompass all former republics of the USSR including Baltic states in all years. The only exception is Armenia which is coded separately in 1930-1940. Various other areas have been grouped together but do not appear in the top five countries for the U.S.
Source: U.S. Census Bureau, “Historical Census Statistics on the Foreign-Born Population of the United States: 1850-2000”; Pew Research Center tabulations of complete count census data for 1850-1940; census samples for 1950 (1%), 1960, 1980-2000 (5%) and 1970 (1% form 1); 2010 and 2022 American Community Survey (1%). Alaska and Hawaii from samples for 1900-1920 (1%) and 1930 (5%). All data from IPUMS.
1950
Top five foreign-born populations by country of origin (in millions)
Total U.S. population 150.2 million
Total foreign born 10.3 million
Percentage foreign born 6.9%
Note: Populations rounded to nearest 10,000. Shares and ranks based on unrounded numbers. Germany includes East and West Germany (1980-1990), German states coded by IPUMS (1850-1940). Alsace and Lorraine are part of Germany for 1870-1910 and France in other years. United Kingdom (UK) includes England, Scotland, Wales and Channel Islands in all years and Northern Ireland in 1930 and later. China includes Mongolia and Taiwan for 1850-1940; Hong Kong and Macau for 2000 and later. Poland includes areas designated as Poland by IPUMS (1850-1940) including “Austrian,” “German,” “Prussian” and “Russian” Poland. The term “Russia” is used for 1850-1920, “USSR” for 1930-1990 and “USSR (former)” for 2000 and later. These areas encompass all former republics of the USSR including Baltic states in all years. The only exception is Armenia which is coded separately in 1930-1940. Various other areas have been grouped together but do not appear in the top five countries for the U.S.
Source: U.S. Census Bureau, “Historical Census Statistics on the Foreign-Born Population of the United States: 1850-2000”; Pew Research Center tabulations of complete count census data for 1850-1940; census samples for 1950 (1%), 1960, 1980-2000 (5%) and 1970 (1% form 1); 2010 and 2022 American Community Survey (1%). Alaska and Hawaii from samples for 1900-1920 (1%) and 1930 (5%). All data from IPUMS.
1960
Top five foreign-born populations by country of origin (in millions)
Total U.S. population 179.3 million
Total foreign born 9.7 million
Percentage foreign born 5.4%
Note: Populations rounded to nearest 10,000. Shares and ranks based on unrounded numbers. Germany includes East and West Germany (1980-1990), German states coded by IPUMS (1850-1940). Alsace and Lorraine are part of Germany for 1870-1910 and France in other years. United Kingdom (UK) includes England, Scotland, Wales and Channel Islands in all years and Northern Ireland in 1930 and later. China includes Mongolia and Taiwan for 1850-1940; Hong Kong and Macau for 2000 and later. Poland includes areas designated as Poland by IPUMS (1850-1940) including “Austrian,” “German,” “Prussian” and “Russian” Poland. The term “Russia” is used for 1850-1920, “USSR” for 1930-1990 and “USSR (former)” for 2000 and later. These areas encompass all former republics of the USSR including Baltic states in all years. The only exception is Armenia which is coded separately in 1930-1940. Various other areas have been grouped together but do not appear in the top five countries for the U.S.
Source: U.S. Census Bureau, “Historical Census Statistics on the Foreign-Born Population of the United States: 1850-2000”; Pew Research Center tabulations of complete count census data for 1850-1940; census samples for 1950 (1%), 1960, 1980-2000 (5%) and 1970 (1% form 1); 2010 and 2022 American Community Survey (1%). Alaska and Hawaii from samples for 1900-1920 (1%) and 1930 (5%). All data from IPUMS.
1970
Top five foreign-born populations by country of origin (in millions)
Total U.S. population 203.2 million
Total foreign born 9.6 million
Percentage foreign born 4.7%
Note: Populations rounded to nearest 10,000. Shares and ranks based on unrounded numbers. Germany includes East and West Germany (1980-1990), German states coded by IPUMS (1850-1940). Alsace and Lorraine are part of Germany for 1870-1910 and France in other years. United Kingdom (UK) includes England, Scotland, Wales and Channel Islands in all years and Northern Ireland in 1930 and later. China includes Mongolia and Taiwan for 1850-1940; Hong Kong and Macau for 2000 and later. Poland includes areas designated as Poland by IPUMS (1850-1940) including “Austrian,” “German,” “Prussian” and “Russian” Poland. The term “Russia” is used for 1850-1920, “USSR” for 1930-1990 and “USSR (former)” for 2000 and later. These areas encompass all former republics of the USSR including Baltic states in all years. The only exception is Armenia which is coded separately in 1930-1940. Various other areas have been grouped together but do not appear in the top five countries for the U.S.
Source: U.S. Census Bureau, “Historical Census Statistics on the Foreign-Born Population of the United States: 1850-2000”; Pew Research Center tabulations of complete count census data for 1850-1940; census samples for 1950 (1%), 1960, 1980-2000 (5%) and 1970 (1% form 1); 2010 and 2022 American Community Survey (1%). Alaska and Hawaii from samples for 1900-1920 (1%) and 1930 (5%). All data from IPUMS.
1980
Top five foreign-born populations by country of origin (in millions)
Total U.S. population 226.5 million
Total foreign born 14.1 million
Percentage foreign born 6.2%
Note: Populations rounded to nearest 10,000. Shares and ranks based on unrounded numbers. Germany includes East and West Germany (1980-1990), German states coded by IPUMS (1850-1940). Alsace and Lorraine are part of Germany for 1870-1910 and France in other years. United Kingdom (UK) includes England, Scotland, Wales and Channel Islands in all years and Northern Ireland in 1930 and later. China includes Mongolia and Taiwan for 1850-1940; Hong Kong and Macau for 2000 and later. Poland includes areas designated as Poland by IPUMS (1850-1940) including “Austrian,” “German,” “Prussian” and “Russian” Poland. The term “Russia” is used for 1850-1920, “USSR” for 1930-1990 and “USSR (former)” for 2000 and later. These areas encompass all former republics of the USSR including Baltic states in all years. The only exception is Armenia which is coded separately in 1930-1940. Various other areas have been grouped together but do not appear in the top five countries for the U.S.
Source: U.S. Census Bureau, “Historical Census Statistics on the Foreign-Born Population of the United States: 1850-2000”; Pew Research Center tabulations of complete count census data for 1850-1940; census samples for 1950 (1%), 1960, 1980-2000 (5%) and 1970 (1% form 1); 2010 and 2022 American Community Survey (1%). Alaska and Hawaii from samples for 1900-1920 (1%) and 1930 (5%). All data from IPUMS.
1990
Top five foreign-born populations by country of origin (in millions)
Total U.S. population 248.7 million
Total foreign born 19.8 million
Percentage foreign born 7.9%
Note: Populations rounded to nearest 10,000. Shares and ranks based on unrounded numbers. Germany includes East and West Germany (1980-1990), German states coded by IPUMS (1850-1940). Alsace and Lorraine are part of Germany for 1870-1910 and France in other years. United Kingdom (UK) includes England, Scotland, Wales and Channel Islands in all years and Northern Ireland in 1930 and later. China includes Mongolia and Taiwan for 1850-1940; Hong Kong and Macau for 2000 and later. Poland includes areas designated as Poland by IPUMS (1850-1940) including “Austrian,” “German,” “Prussian” and “Russian” Poland. The term “Russia” is used for 1850-1920, “USSR” for 1930-1990 and “USSR (former)” for 2000 and later. These areas encompass all former republics of the USSR including Baltic states in all years. The only exception is Armenia which is coded separately in 1930-1940. Various other areas have been grouped together but do not appear in the top five countries for the U.S.
Source: U.S. Census Bureau, “Historical Census Statistics on the Foreign-Born Population of the United States: 1850-2000”; Pew Research Center tabulations of complete count census data for 1850-1940; census samples for 1950 (1%), 1960, 1980-2000 (5%) and 1970 (1% form 1); 2010 and 2022 American Community Survey (1%). Alaska and Hawaii from samples for 1900-1920 (1%) and 1930 (5%). All data from IPUMS.
2000
Top five foreign-born populations by country of origin (in millions)
Total U.S. population 281.4 million
Total foreign born 31.1 million
Percentage foreign born 11.1%
Note: Populations rounded to nearest 10,000. Shares and ranks based on unrounded numbers. Germany includes East and West Germany (1980-1990), German states coded by IPUMS (1850-1940). Alsace and Lorraine are part of Germany for 1870-1910 and France in other years. United Kingdom (UK) includes England, Scotland, Wales and Channel Islands in all years and Northern Ireland in 1930 and later. China includes Mongolia and Taiwan for 1850-1940; Hong Kong and Macau for 2000 and later. Poland includes areas designated as Poland by IPUMS (1850-1940) including “Austrian,” “German,” “Prussian” and “Russian” Poland. The term “Russia” is used for 1850-1920, “USSR” for 1930-1990 and “USSR (former)” for 2000 and later. These areas encompass all former republics of the USSR including Baltic states in all years. The only exception is Armenia which is coded separately in 1930-1940. Various other areas have been grouped together but do not appear in the top five countries for the U.S.
Source: U.S. Census Bureau, “Historical Census Statistics on the Foreign-Born Population of the United States: 1850-2000”; Pew Research Center tabulations of complete count census data for 1850-1940; census samples for 1950 (1%), 1960, 1980-2000 (5%) and 1970 (1% form 1); 2010 and 2022 American Community Survey (1%). Alaska and Hawaii from samples for 1900-1920 (1%) and 1930 (5%). All data from IPUMS.
2010
Top five foreign-born populations by country of origin (in millions)
Total U.S. population 309.4 million
Total foreign born 40.0 million
Percentage foreign born 12.9%
Note: Populations rounded to nearest 10,000. Shares and ranks based on unrounded numbers. Germany includes East and West Germany (1980-1990), German states coded by IPUMS (1850-1940). Alsace and Lorraine are part of Germany for 1870-1910 and France in other years. United Kingdom (UK) includes England, Scotland, Wales and Channel Islands in all years and Northern Ireland in 1930 and later. China includes Mongolia and Taiwan for 1850-1940; Hong Kong and Macau for 2000 and later. Poland includes areas designated as Poland by IPUMS (1850-1940) including “Austrian,” “German,” “Prussian” and “Russian” Poland. The term “Russia” is used for 1850-1920, “USSR” for 1930-1990 and “USSR (former)” for 2000 and later. These areas encompass all former republics of the USSR including Baltic states in all years. The only exception is Armenia which is coded separately in 1930-1940. Various other areas have been grouped together but do not appear in the top five countries for the U.S.
Source: U.S. Census Bureau, “Historical Census Statistics on the Foreign-Born Population of the United States: 1850-2000”; Pew Research Center tabulations of complete count census data for 1850-1940; census samples for 1950 (1%), 1960, 1980-2000 (5%) and 1970 (1% form 1); 2010 and 2022 American Community Survey (1%). Alaska and Hawaii from samples for 1900-1920 (1%) and 1930 (5%). All data from IPUMS.
2022
Top five foreign-born populations by country of origin (in millions)
Total U.S. population 333.3 million
Total foreign born 46.1 million
Percentage foreign born 13.8%
Note: Populations rounded to nearest 10,000. Shares and ranks based on unrounded numbers. Germany includes East and West Germany (1980-1990), German states coded by IPUMS (1850-1940). Alsace and Lorraine are part of Germany for 1870-1910 and France in other years. United Kingdom (UK) includes England, Scotland, Wales and Channel Islands in all years and Northern Ireland in 1930 and later. China includes Mongolia and Taiwan for 1850-1940; Hong Kong and Macau for 2000 and later. Poland includes areas designated as Poland by IPUMS (1850-1940) including “Austrian,” “German,” “Prussian” and “Russian” Poland. The term “Russia” is used for 1850-1920, “USSR” for 1930-1990 and “USSR (former)” for 2000 and later. These areas encompass all former republics of the USSR including Baltic states in all years. The only exception is Armenia which is coded separately in 1930-1940. Various other areas have been grouped together but do not appear in the top five countries for the U.S.
Source: U.S. Census Bureau, “Historical Census Statistics on the Foreign-Born Population of the United States: 1850-2000”; Pew Research Center tabulations of complete count census data for 1850-1940; census samples for 1950 (1%), 1960, 1980-2000 (5%) and 1970 (1% form 1); 2010 and 2022 American Community Survey (1%). Alaska and Hawaii from samples for 1900-1920 (1%) and 1930 (5%). All data from IPUMS.
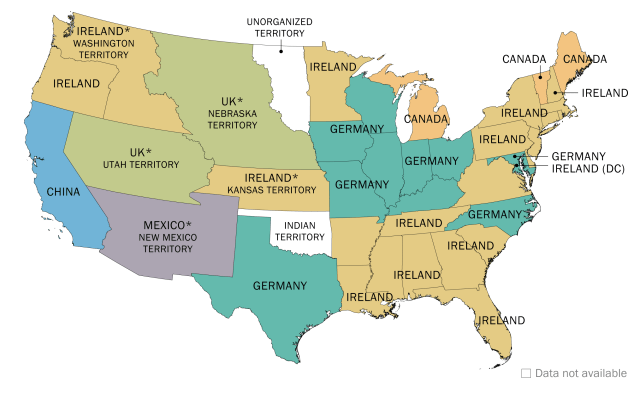
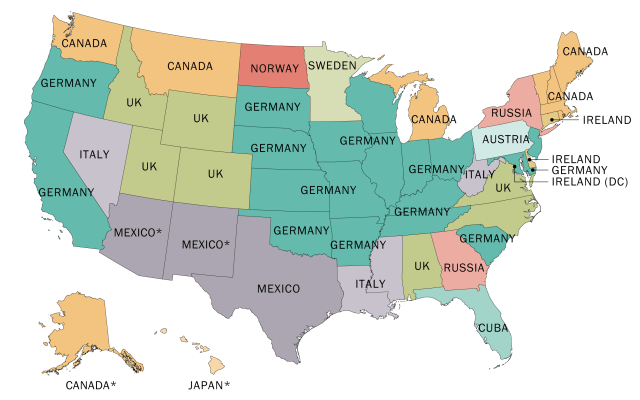
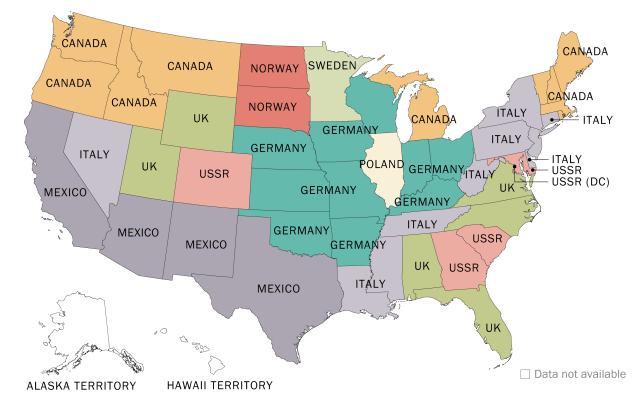
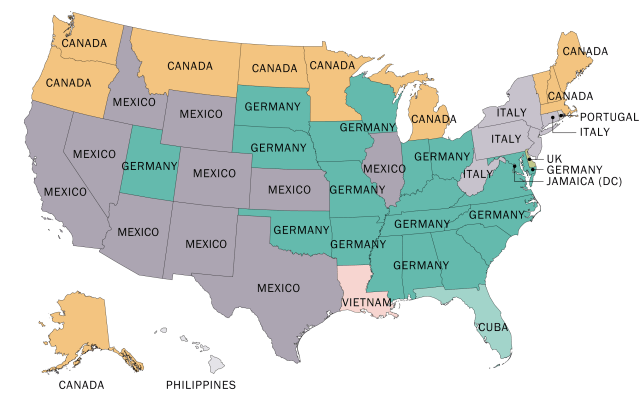
From 1850 to 1880, Germany and Ireland were the largest immigrant origin countries in most states and territories. In 1860, Ireland was the largest origin country in 22 of the nation’s 39 states and territories.
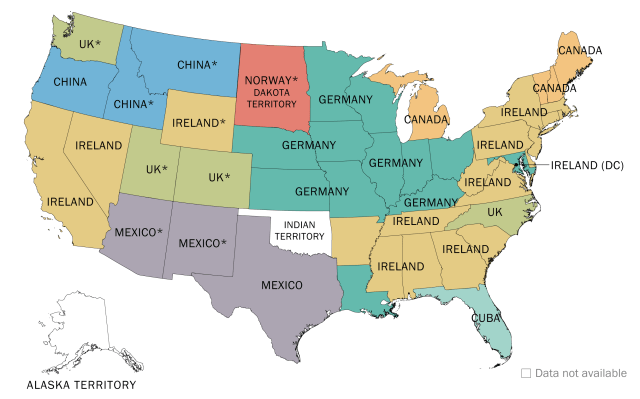
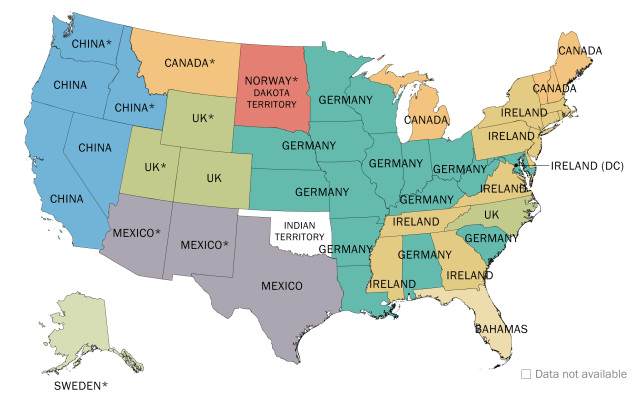
By 1880, Germany was the largest origin country in 16 states and territories. Chinese immigrants were the largest group in California, Nevada, Oregon, and the Idaho and Washington territories. Mexicans were the largest group in Texas and the New Mexico and Arizona territories.
1890-1919
The next wave of immigration to the U.S. lasted from 1890 to 1919, when more than 18 million immigrants arrived. By then, over 60% came from Eastern and Southern Europe, with large numbers arriving from Italy, Austria-Hungary, Russia and Poland.
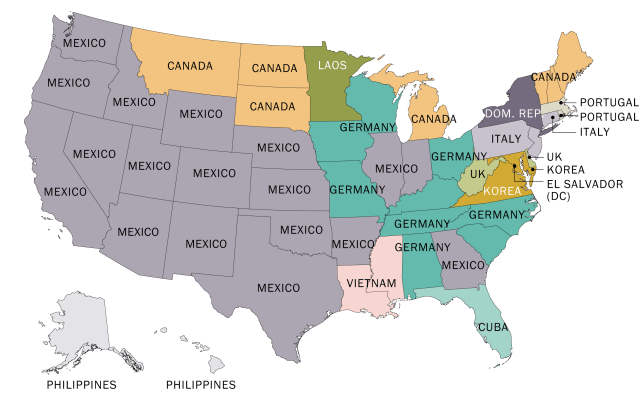
1920-1964
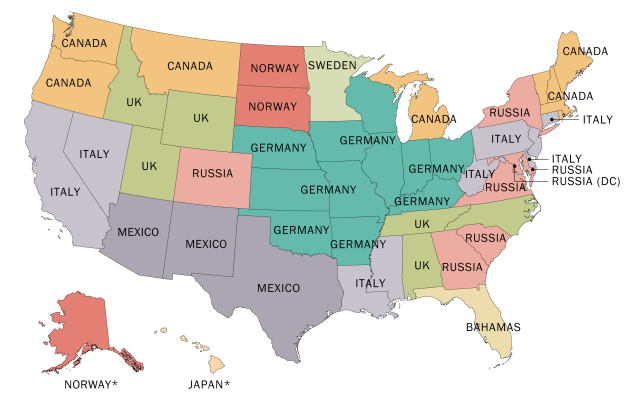
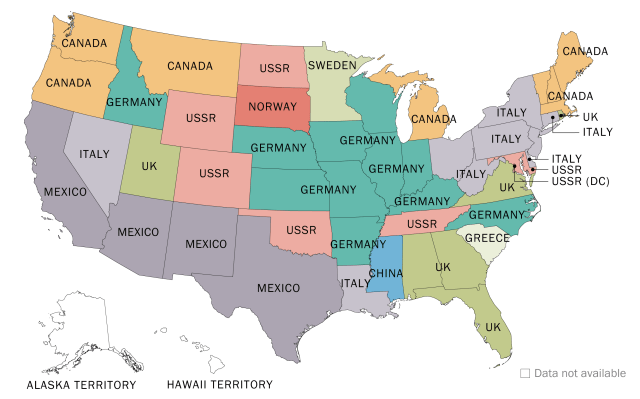
The number of new immigrants fell dramatically in the years between World War I and World War II (1919 to 1939). As a result, the largest immigrant groups in each state did not change much for the next few decades.
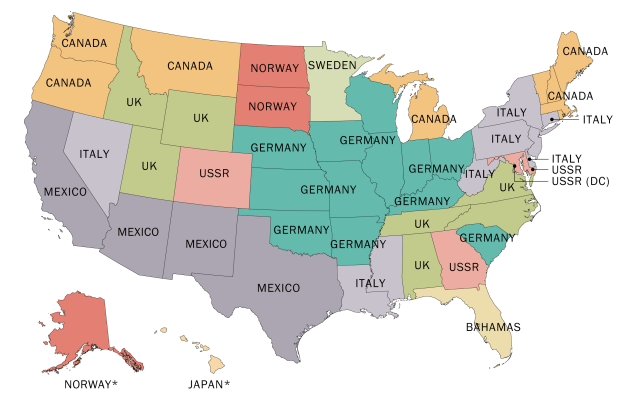
In 1920, German immigrants were the largest group in 11 states, down from 18 in 1910. Immigrants from Italy and Russia became the largest groups in a growing number of states. At their peaks, Italians were the largest group in 10 states in 1940 and 1960, and Russians were the biggest in seven states in 1920 and 1950.
By 1960, the largest number of immigrants in most states came from Germany (17 states), Italy (10) and Canada (10).
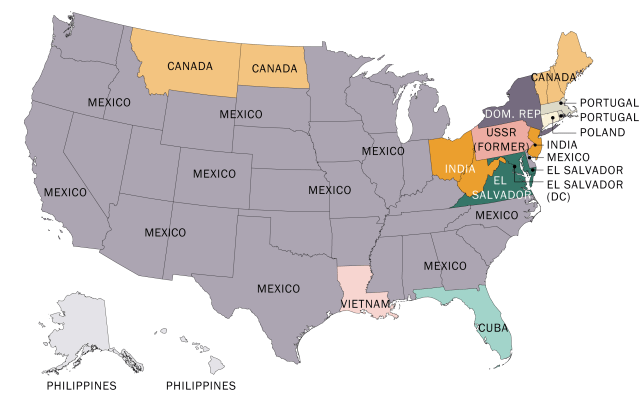
1965-2007
Another wave of immigration began in 1965. Most immigrants in this wave came from Latin America (49%) or Asia (27%). Mexico alone accounted for about 25% of these new immigrants. Large numbers also came from China, India, the Philippines, Central America and the Caribbean.
After 1990, the number of unauthorized immigrants in the U.S. started to grow quickly, from 3.5 million to 12.2 million in 2007. Most unauthorized immigrants in the U.S. at this time came from Mexico, which was also the largest source of legal immigrants.
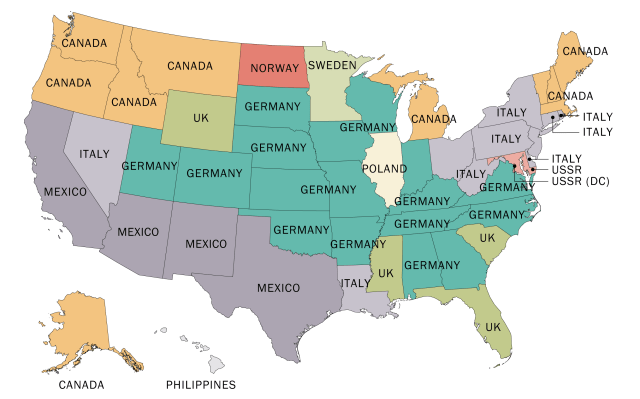
These new legal and unauthorized arrivals led to major changes in states’ immigrant populations. Mexican immigrants became the largest group in an increasing number of states.
In 1980, Mexican immigrants were the largest group in 10 states, trailing German immigrants (19 states) and Canadian immigrants (11 states).
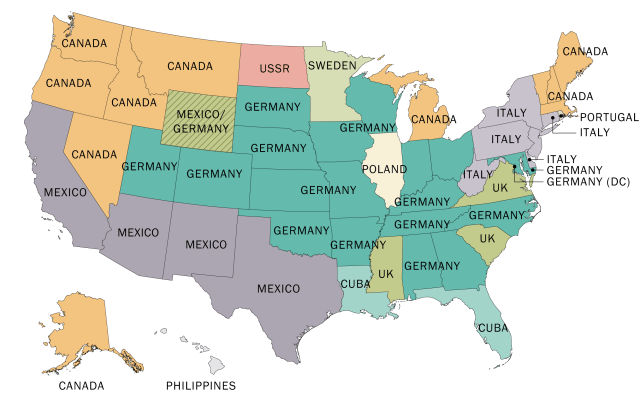
By 2000, Mexican immigrants were the largest group in 31 states, and Germans were no longer the largest immigrant group in any state. Immigrants from Cuba, El Salvador, the Dominican Republic, Vietnam, the Philippines and India were the largest groups in 11 states.
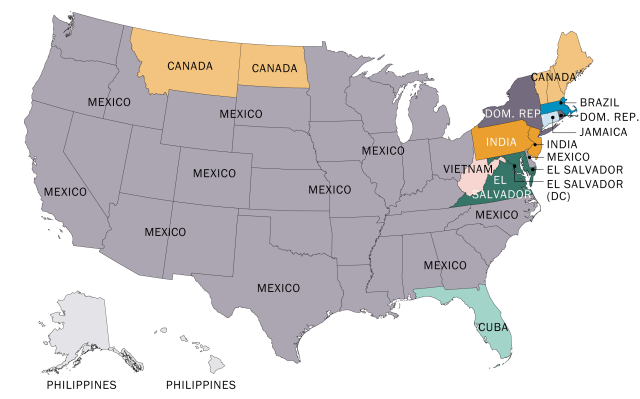
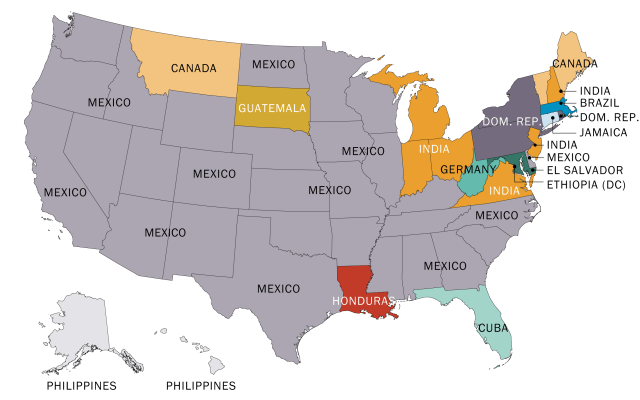
2008-today
The onset of the Great Recession led to changes in immigration patterns. Mexican immigration to the U.S. slowed dramatically after 2007. As a result, the Mexican immigrant population stopped growing. Though Mexico remained the largest source of U.S. immigrants, Mexicans’ share of the immigrant population fell from 29% in 2010 to 23% in 2022.
Meanwhile, immigration from Asia increased rapidly. In the 2010s, there were more new arrivals from Asia than from Latin America.
The unauthorized immigrant population declined from 12.2 million in 2007 to 10.2 million in 2019. Since then, though, the unauthorized immigrant population has grown again, reaching 11.0 million in 2022.
Mexico remained the largest country of birth for immigrants in 29 states in 2022, while India was the largest in six states. For the first time, the following origin groups made up the largest immigrant population in a state or district:
Ethiopians in the District of Columbia
Guatemalans in South Dakota
Hondurans in Louisiana
Note: This is an update of a post originally published Oct. 7, 2015.
Source link : https://www.pewresearch.org/short-reads/2024/07/22/how-the-origins-of-americas-immigrants-have-changed-since-1850/
Author :
Publish date : 2024-07-23 03:14:48
Copyright for syndicated content belongs to the linked Source.


