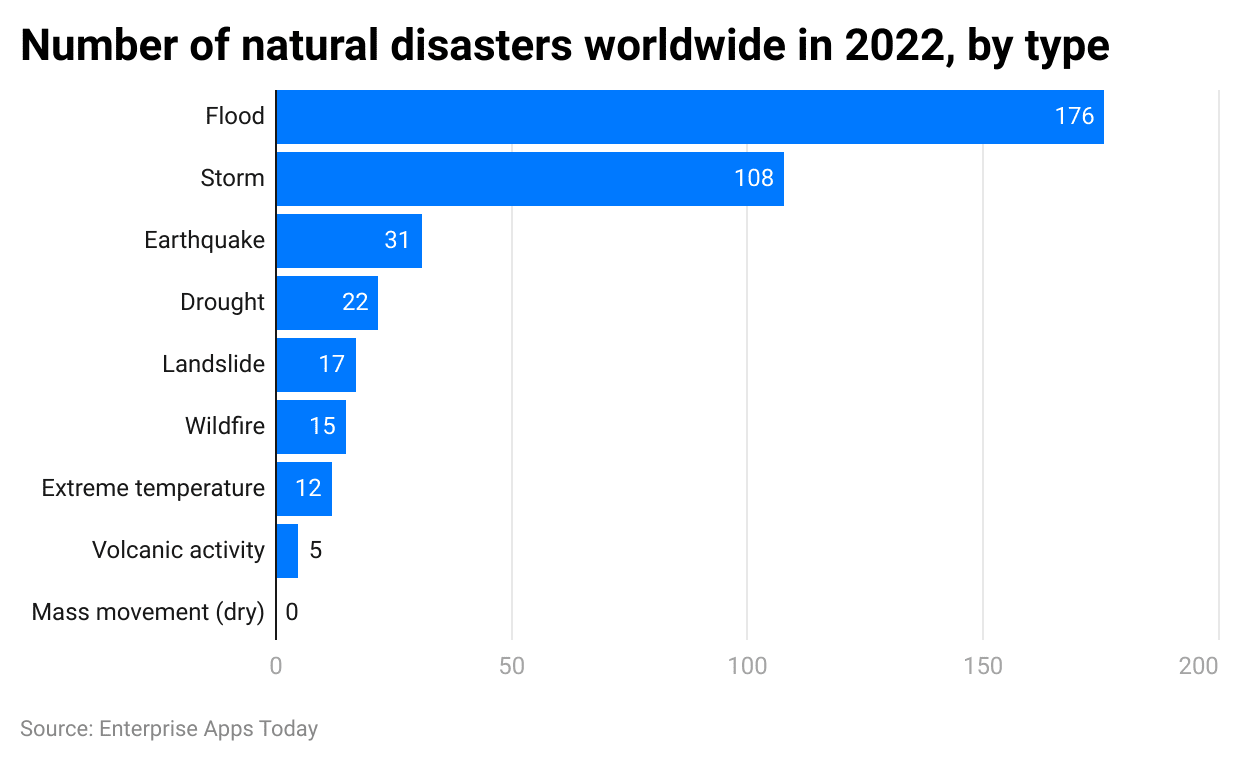
(Reference: forbes.com)
In the USA during 2022, severe storms and tropical cyclones were the most prevalent natural disasters, occurring 11 and 3 times respectively. Other events like drought, winter storms, wildfires, and flooding each had 1 occurrence. These events collectively resulted in billions of dollars in damages and nearly 400 fatalities.
Natural Disaster Statistics by Country
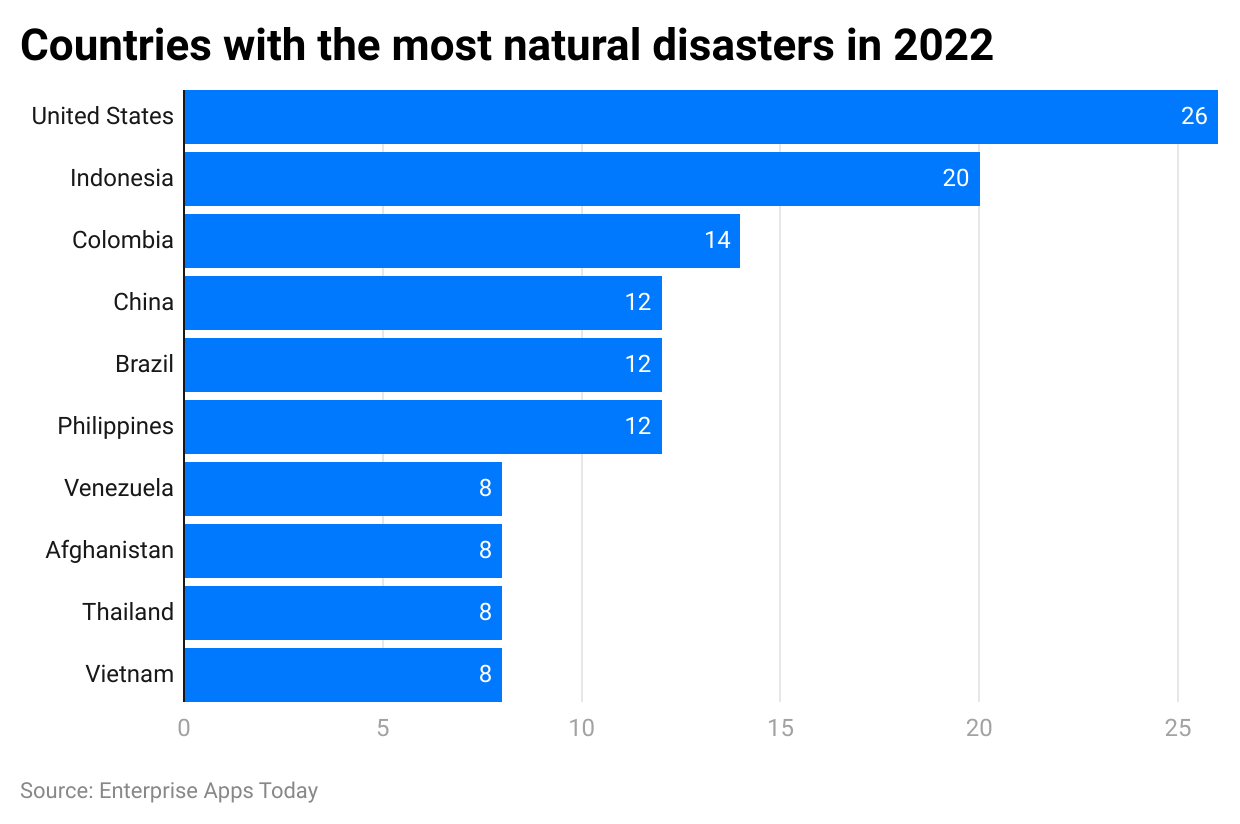
(Reference: statista.com)
In 2022, the United States experienced the highest number of natural disasters globally, reaching 22 incidents. Following the US were Indonesia with 20 incidents and Colombia with 14. Additionally, countries such as China, Brazil, the Philippines, Venezuela, Afghanistan, Thailand, and Vietnam faced significant numbers of natural disasters.
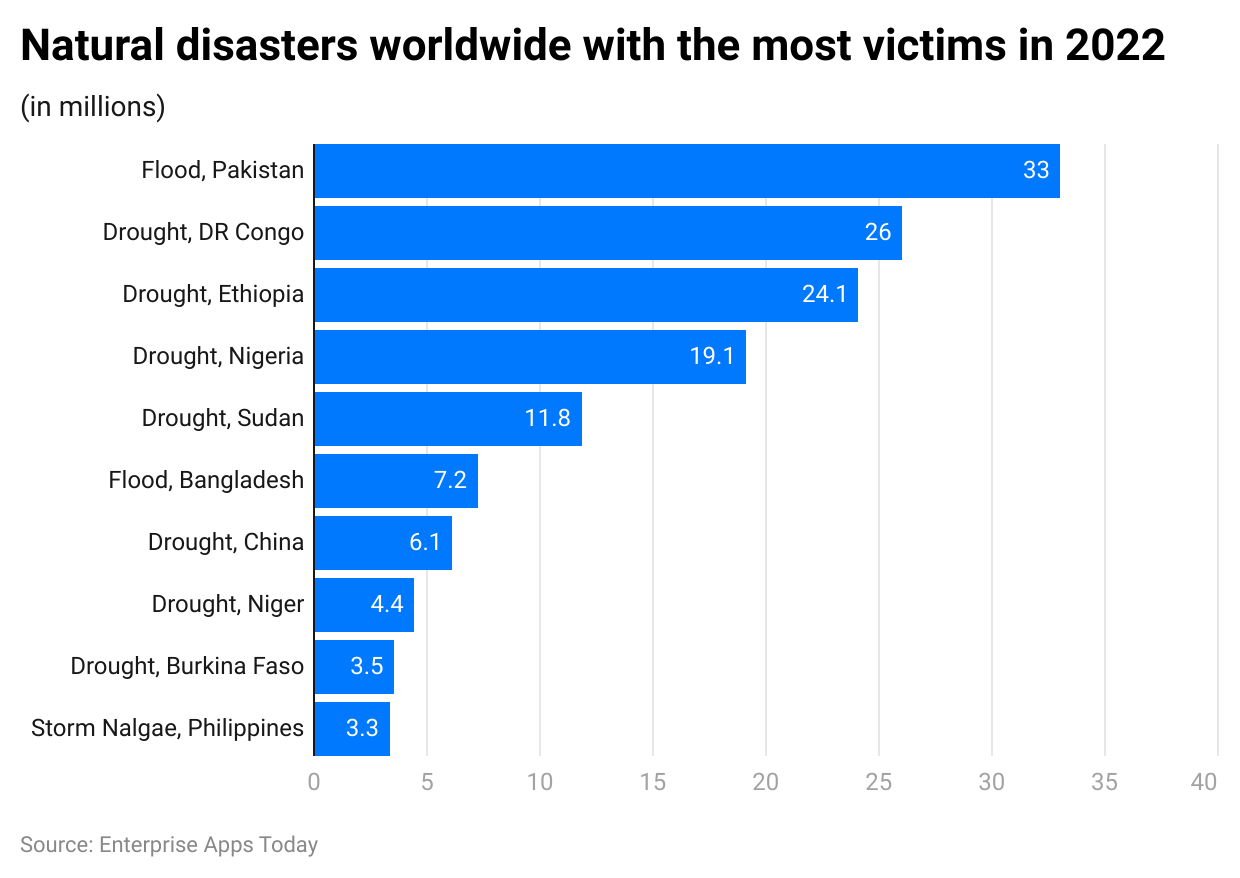
(Reference: statista.com)
Regarding global Natural Disaster Statistics, floods in Pakistan led to 33 million victims in 2022. Additionally, various African regions like DR Congo, Ethiopia, Nigeria, and Sudan witnessed significant deaths due to drought, totaling 26 million, 24.1 million, 19.1 million, and 11.8 million respectively. Moreover, countries such as Bangladesh, China, Niger, Burkina Faso, and the Philippines reported high victim counts due to natural disasters like floods, droughts, and storms.
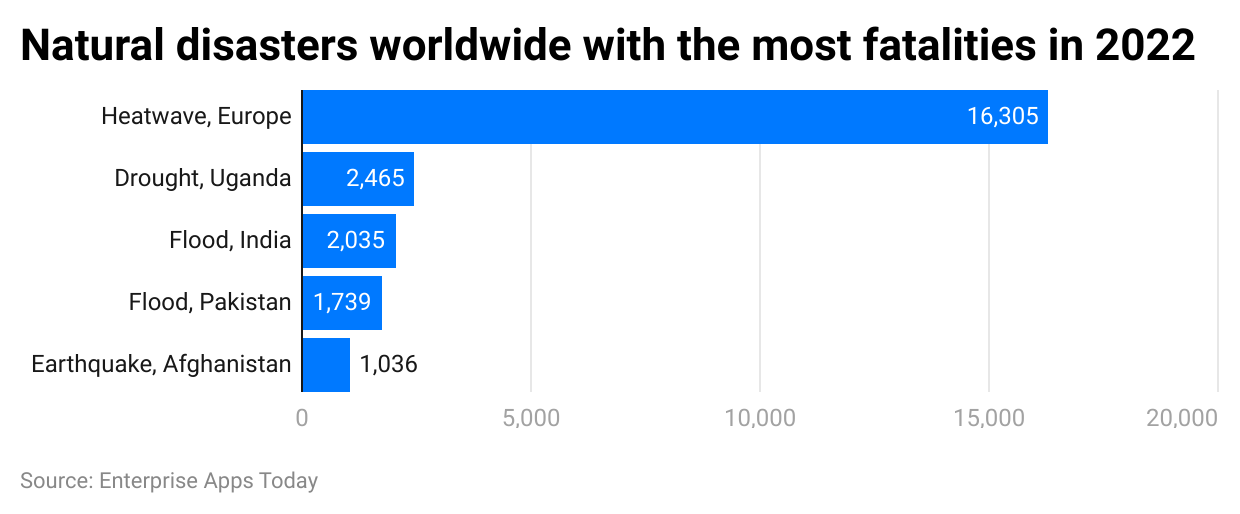
(Reference: statista.com)
In 2022, as reported by Natural Disaster Statistics, Europe experienced 16,305 deaths due to heatwaves, with Uganda following with 2,465 deaths from drought and India with 2,035 deaths from floods. Additionally, unfortunate fatalities were caused by floods in Pakistan and earthquakes in Afghanistan, leading to 1,036 deaths each, totaling 1,739 and 1,036 respectively.
Displayed below is an image that illustrates the countries with the highest disaster risk worldwide in 2023. The World Risk Index points to a high risk in countries such as the Philippines, Indonesia, and India, with percentages of 46.86%, 43.5%, and 41.52% respectively. On the contrary, Somalia, Vietnam, and Yemen are at a comparatively lower risk of being affected by natural disasters.
(Reference: statista.com)
Most Expensive Natural Disasters to Date in the USA by Cost
Looking back at 2005, Hurricane Katrina severely impacted the USA with a staggering $193.8 billion economic cost. Subsequent hurricanes in the years that followed, specifically Hurricane Harvey in 2017 and Hurricane Ian in 2022, incurred costs of $155 billion and $115.2 billion respectively.
(Reference: statista.com)
Another noteworthy statistic pertains to the costliest natural disasters in the United States over the last two decades. Tropical cyclones, severe storms, and droughts accounted for the most substantial economic impacts, with percentages of 53%, 16%, and 13% respectively.
 Natural Disaster Statistics by Number of Affected Homes
Number of Homes Affected
Cost to RebuildÂą
Hurricane Wind Risk Level
Single Family Homes
Multifamily Homes
Single Family Homes
Multifamily Homes
Extreme
6,316,115
122,087
$1.65 Trillion
$42.1 Billion
Very High or Greater
14,654,510
229,077
$4.02 Trillion
$85 Billion
High or Greater
22,113,248
647,060
$6.7 Trillion
$327.4 Billion
Moderate or Greater
31,792,966
987,727
$9.98 Trillion
$519.5 Billion
(Source: forbes.com)
As of 2022, there were a total of 31,792,966 single homes affected at moderate or greater levels and 987,727 multifamily homes. Conversely, the extremely impacted single-family and multifamily homes numbered 6,316,115 and 122,087 respectively, with significant costs associated with rebuilding each type.
Top 10 Most Significant Natural Disasters by Death Toll
Highlighted below is an image showing the 10 natural disasters with the highest death tolls worldwide from 1950 to 2022. One of the most devastating incidents was the Cyclone Bhola in Bangladesh in 1970, which claimed the lives of 300,000 people. Other tragic events include the Tangshan earthquake in China in 1976, resulting in 242,769 deaths, and Super Typhoon Nina in Taiwan in 1975, leading to 230,029 deaths.
(Reference: statista.com)
 Natural Disaster Statistics by Region
Lastly, the image below depicts the satisfaction barometer in relation to natural disasters. It provides an overview of regional trends and statistics.
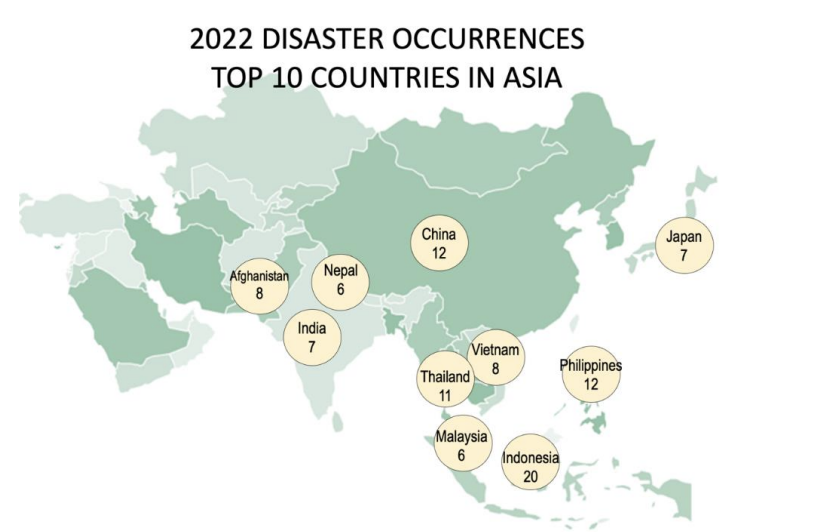
(Source: reliefweb.int)
The top 10 countries in Asia region with the highest number of natural disasters were Malaysia, Nepal (6), Japan, India (7), Afghanistan, Vietnam (8), Philippines, China (12), and Indonesia (20) as of 2022.
Safest Countries by World Risk Index 2022
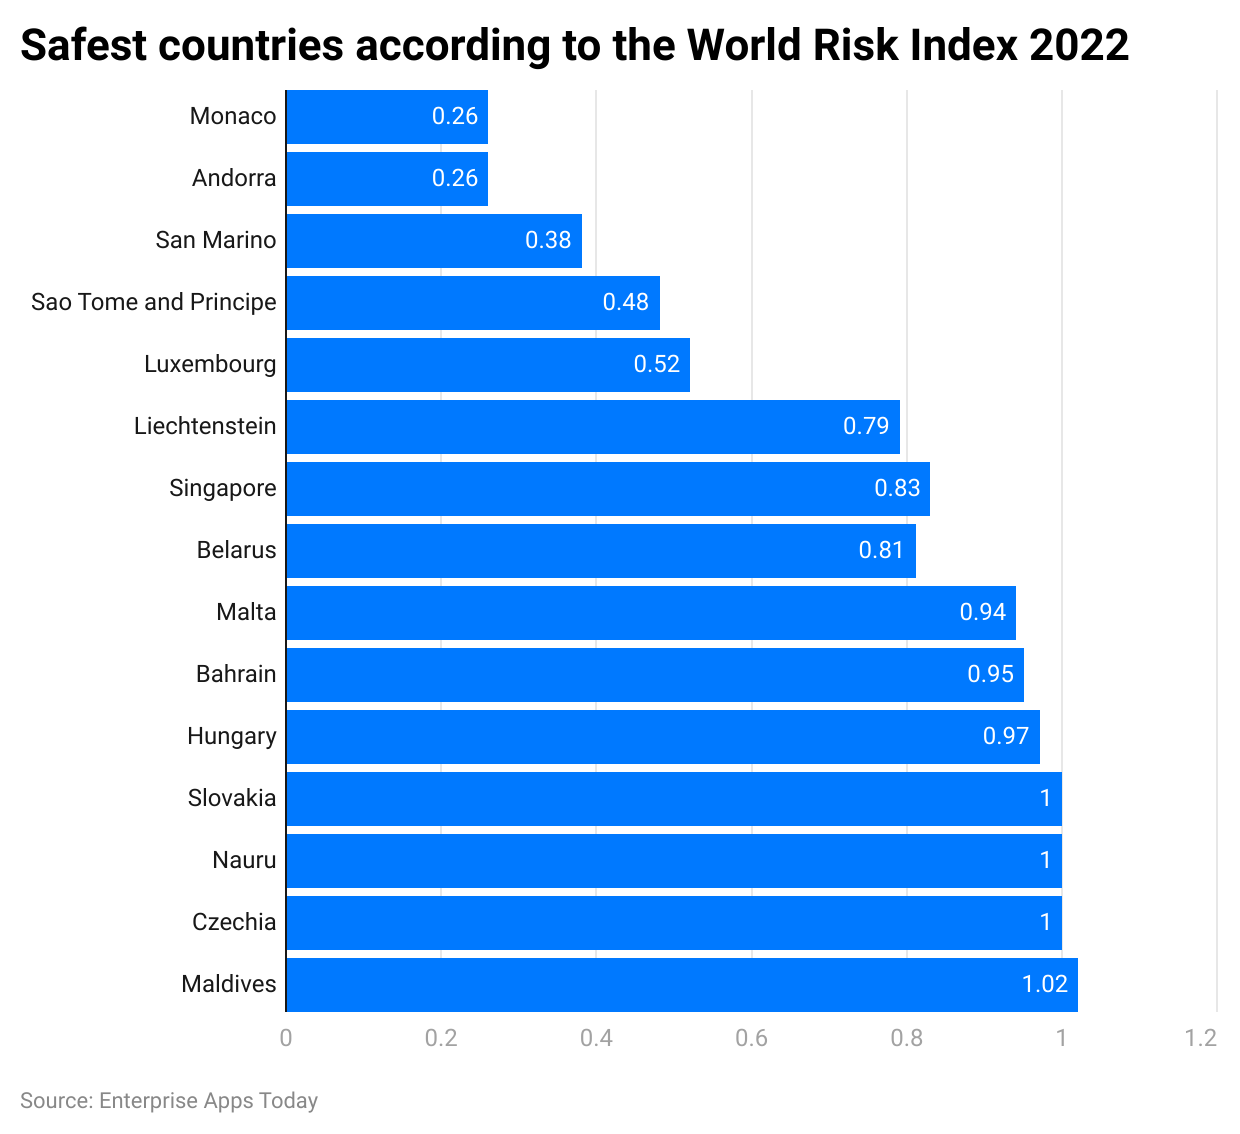
(Reference: statista.com)
Monaco, Andorra, and San Marino were the safest countries in the world according to the World Risk Index score of 0.26 and 0.38. In contrast, Maldives had the lowest score of 1.02.
Countries with the Most Active Volcanos since 1960
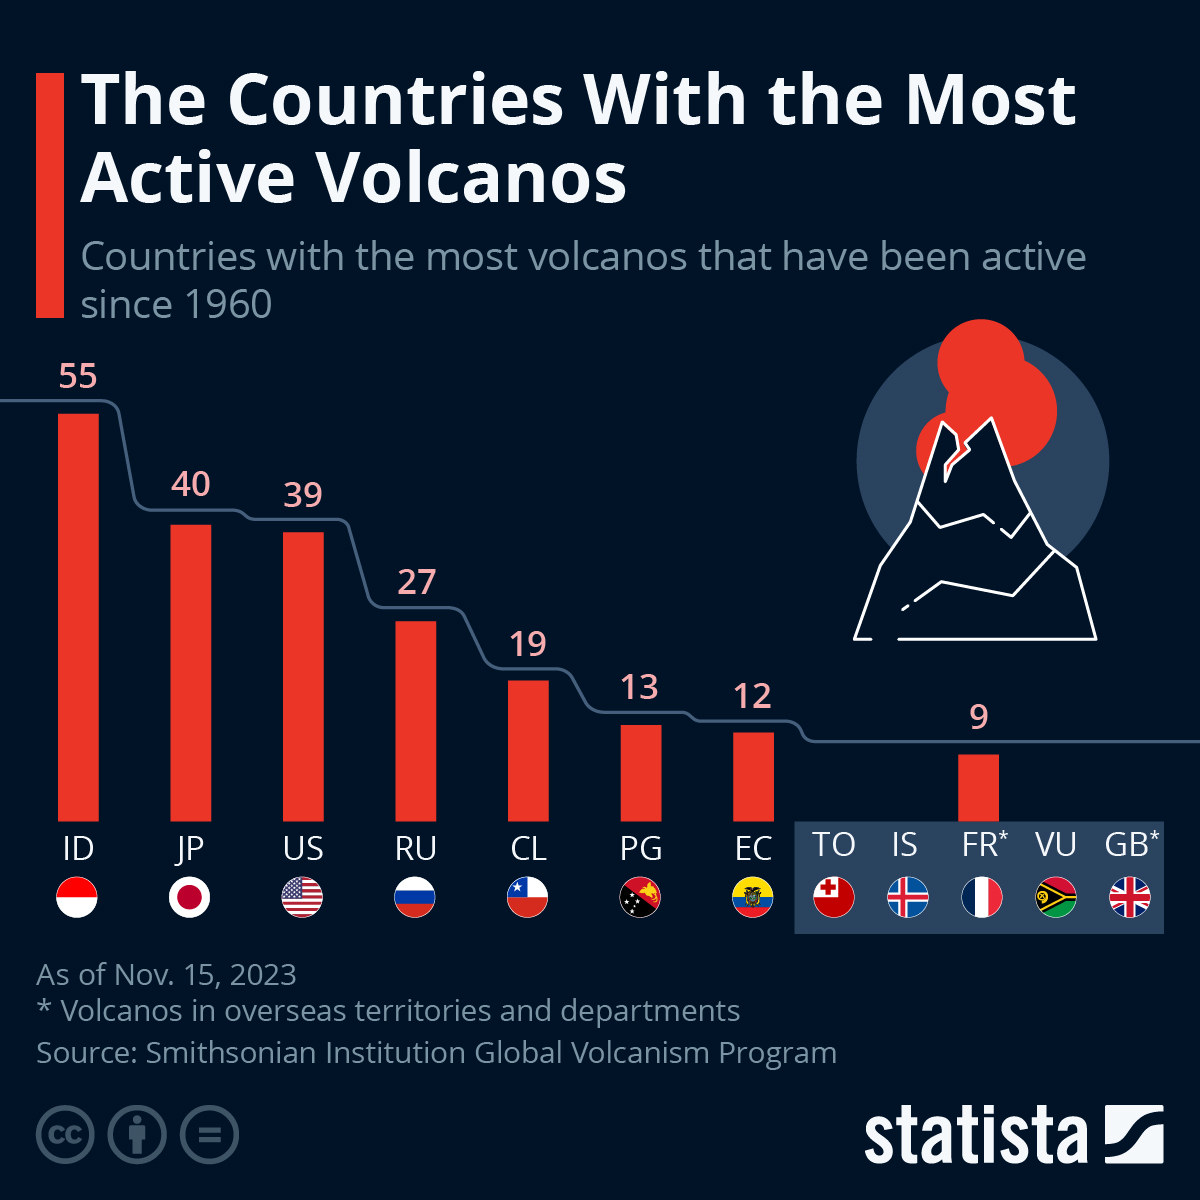
(Source: statista.com)
Countries with Volcanic Eruptions in 2023
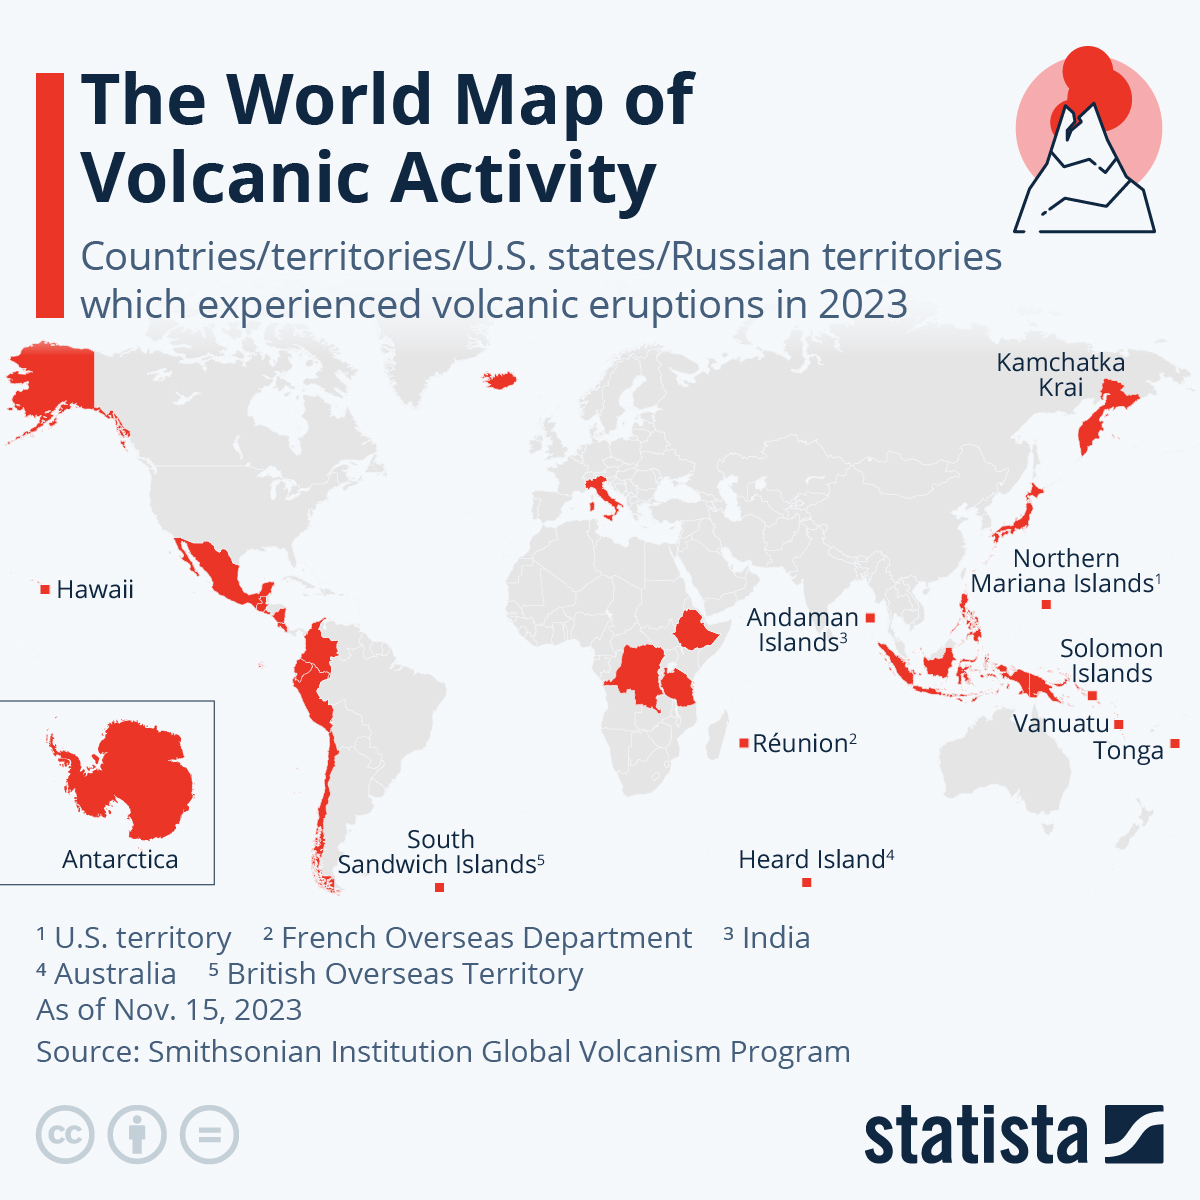
(Source: statista.com)
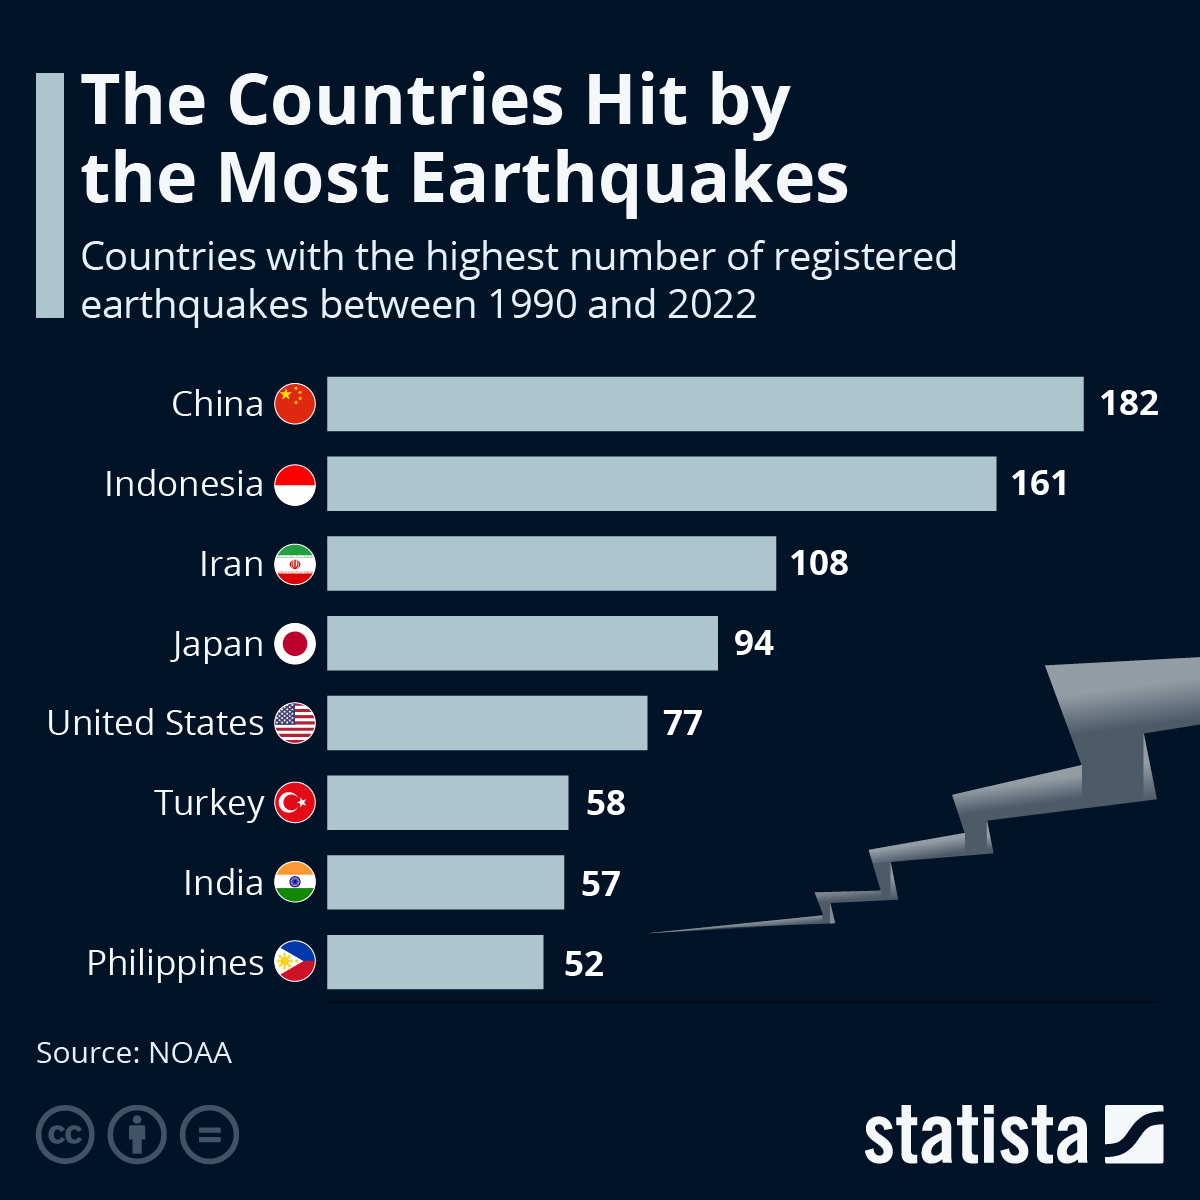
Countries with the Most Earthquakes between 1990 to 2022
(Source: statista.com)
Natural Disaster Statistics by Safety Measures
The readiness for natural disasters varies among individuals. The main preparations include reviewing insurance policies (29%), assembling emergency supplies (24%), and making copies of important documents (23%). Other measures involve enhancing homes or vehicles, setting up emergency funds, creating home inventories, etc. Despite these efforts, 44% of people still lack specific preparations.
Conclusion
The planet is facing significant challenges due to global warming and destructive human activities. This has led to an increase in earthquakes, tsunamis, and storms worldwide. The escalating Natural Disaster Statistics highlight the rise in such catastrophic events. Unfortunately, millions of individuals are losing their homes and lives. Glaciers are melting, and the threat of flooding looms over cities. To mitigate these disasters, we must initiate eco-friendly practices starting from ourselves. By adopting sustainable lifestyles, we can protect our precious planet for future generations.
[3px] border-t-[3px] p-4 border-[#1d598f] my-4″ style=”box-shadow: 0 0 14px rgb(9 38 66 / 8%);”>
Sources
What are the types of natural disasters?
Types of natural disasters include wildfires, blizzards, hailstorms, mudslides, snow storms, volcanic eruptions, earthquakes, hurricanes, tsunamis, avalanches, and tornadoes.
What are the causes of natural disasters?
Natural disasters can be caused by pollutants, global warming, air pressure, deforestation, lunar activities, mining, seismic waves, and tectonic shifts.
When was the first-ever natural disaster occurred?
The first natural disaster, The Lisbon Earthquake, was recorded in 1755, shedding light on the causes of natural disasters.
Natural Disaster Statistics 2024 – By Type, Country, Death Toll, Region, World Risk Index and Safety Measures
Data from 2023 and 2024, along with forecast data for 2025 and 2026, expandable to 2027 and 2028.
——
REFERENCES:
This information was taken from various sources around the world, including these countries:
Australia, Canada, USA, UK, UAE, India, Pakistan, Philippines, Indonesia, Nigeria, Tanzania, Kenya, US, United Kingdom, United States of America, Malaysia, U.S., South Africa, New Zealand, Turkey, United Arab Emirates.
Afghanistan, Albania, Algeria, American Samoa, Andorra, Angola, Anguilla, Antarctica, Antigua and Barbuda, Argentina, Armenia, Aruba, Australia, Austria, Azerbaijan.
Bahamas, Bahrain, Bangladesh, Barbados, Belarus, Belgium, Belize, Benin, Bermuda, Bhutan, Bolivia, Bosnia and Herzegovina, Botswana, Bouvet Island, Brazil, British Indian Ocean Territory, Brunei Darussalam, Bulgaria, Burkina Faso, Burundi.
Cambodia, Cameroon, Canada, Cape Verde, Cayman Islands, Central African Republic, Chad, Chile, China, Christmas Island, Cocos (Keeling Islands), Colombia, Comoros, Congo, Cook Islands, Costa Rica, Cote D’Ivoire (Ivory Coast), Croatia (Hrvatska), Cuba, Cyprus, Czech Republic.
Denmark, Djibouti, Dominica, Dominican Republic, East Timor, Ecuador, Egypt, El Salvador, Equatorial Guinea, Eritrea, Estonia, Ethiopia, Falkland Islands (Malvinas), Faroe Islands, Fiji, Finland, France, Metropolitan, French Guiana, French Polynesia, French Southern Territories.
Gabon, Gambia, Georgia, Germany, Ghana, Gibraltar, Greece, Greenland, Grenada, Guadeloupe, Guam, Guatemala, Guinea, Guinea-Bissau, Guyana, Haiti, Heard and McDonald Islands, Honduras, Hong Kong, Hungary, Iceland, India, Indonesia, Iran, Iraq, Ireland, Israel, Italy.
Jamaica, Japan, Jordan, Kazakhstan, Kenya, Kiribati, North Korea, South Korea, Kuwait, Kyrgyzstan, Laos, Latvia, Lebanon, Lesotho, Liberia, Libya, Liechtenstein, Lithuania, Luxembourg.
Macau, Macedonia, Madagascar, Malawi, Malaysia, Maldives, Mali, Malta, Marshall Islands, Martinique, Mauritania, Mauritius, Mayotte, Mexico, Micronesia, Moldova, Monaco, Mongolia, Montserrat, Morocco, Mozambique, Myanmar.
Namibia, Nauru, Nepal, Netherlands, Netherlands Antilles, New Caledonia, New Zealand (NZ), Nicaragua, Niger, Nigeria, Niue, Norfolk Island, Northern Mariana Islands, Norway.
Oman, Pakistan, Palau, Panama, Papua New Guinea, Paraguay, Peru, Philippines, Pitcairn, Poland, Portugal, Puerto Rico, Qatar, Reunion, Romania, Russia, Rwanda, Saint Kitts and Nevis, Saint Lucia, Saint Vincent and The Grenadines, Samoa, San Marino, Sao Tome and Principe.
Saudi Arabia, Senegal, Serbia, Seychelles, Sierra Leone, Singapore, Slovakia, Slovenia, Solomon Islands, Somalia, South Africa, South Georgia and South Sandwich Islands, Spain, Sri Lanka, St. Helena, St. Pierre and Miquelon, Sudan, Suriname, Svalbard and Jan Mayen Islands, Swaziland, Sweden, Switzerland, Syria.
Taiwan, Tajikistan, Tanzania, Thailand, Togo, Tokelau, Tonga, Trinidad and Tobago, Tunisia, Turkey, Turkmenistan, Turks and Caicos Islands, Tuvalu, Uganda, Ukraine, United Arab Emirates (UAE), UK (United Kingdom), USA (United States of America, U.S.), US Minor Outlying Islands.
Uruguay, Uzbekistan, Vanuatu, Vatican City State (Holy See), Venezuela, Vietnam, Virgin Islands (British), Virgin Islands (US), Wallis and Futuna Islands, Western Sahara, Yemen, Yugoslavia, Zaire, Zambia, Zimbabwe.
Natural Disaster Statistics 2024 – By Type, Country, Death Toll, Region, World Risk Index and Safety Measures
August 18, 2024
Source link : http://www.bing.com/news/apiclick.aspx?ref=FexRss&aid=&tid=66c9a78f2fdf4dbc805c52c9ddcd111e&url=https%3A%2F%2Fhollywoodgazette.com%2Fnatural-disaster-statistics-html%2F&c=439751620398524957&mkt=en-us
Author :
Publish date : 2024-08-23 22:19:00
Copyright for syndicated content belongs to the linked Source.


