
Movie distributors in 2022 displayed the top 10 revenue-generating companies at the box office globally.
Leading the market was Walt Disney, responsible for $41,999691,340 in revenue with a 17.01% share from around 600 movie releases.
Following closely was Warner Bros, capturing a 15.11% market share with $37,301,875,235 in revenue and 5,314,239,669 tickets sold.
Sony Pictures held the third position with $30,763,026,050 in total box office revenue, representing a 12.46% share.
Universal, with a 12.10% market share, recorded $29,871,134,131 in revenue with 560 movies released.
20th Century Fox and Paramount Pictures reported revenue of $25,882,657,988 and $25,699,685,719 respectively, with market shares of 10.48% and 10.41% each.
Lionsgate, New Line, DreamWorks SKG, and Miramax contributed to the market with varying shares and revenue levels.
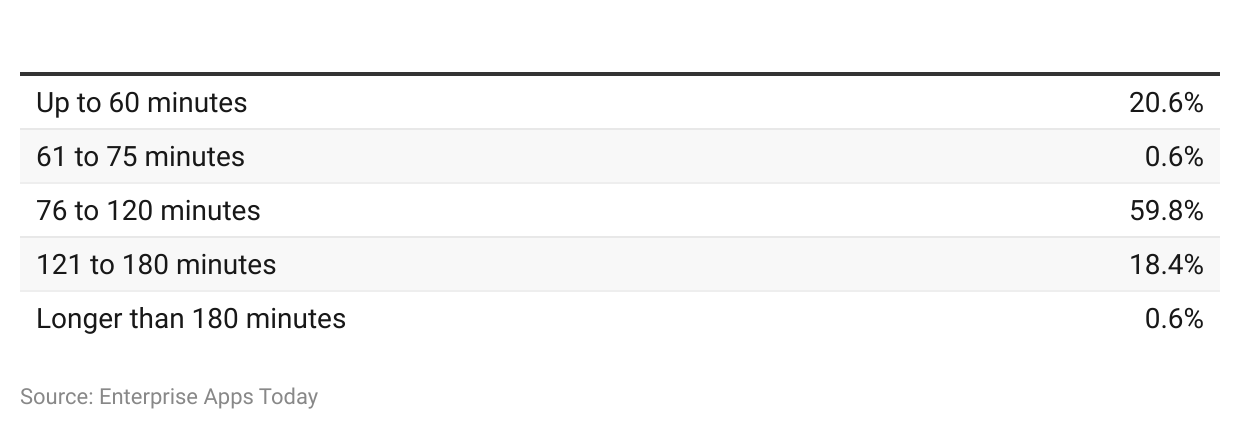
By Running Time
 (Source: NATIONAL STATISTICS OFFICE: MALTA)
The majority of movies in 2022 had a running time between 76-120 minutes, accounting for 59.8%.
About 20.6% of releases were around 60 minutes, while 18.4% fell into the 121-180 minutes category.
Only 0.6% of films were shorter than 61 minutes or longer than 180 minutes.
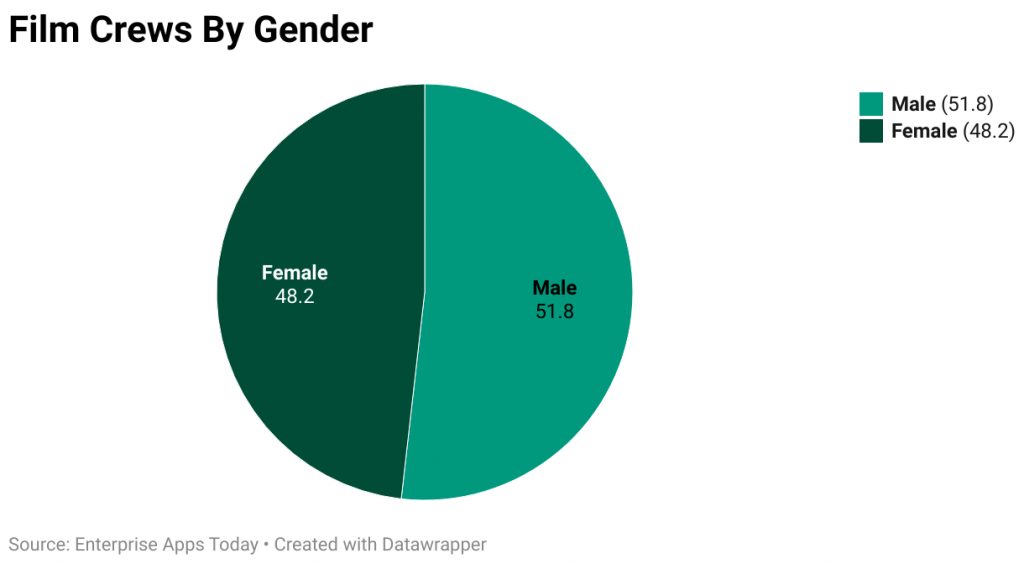
By Demographic
(Source: ZIPPIA)
Males represented 51.8% of film crew members, while females made up 48.2%.
These statistics indicate a male-dominated trend in the film industry.
(Source: ZIPPIA)
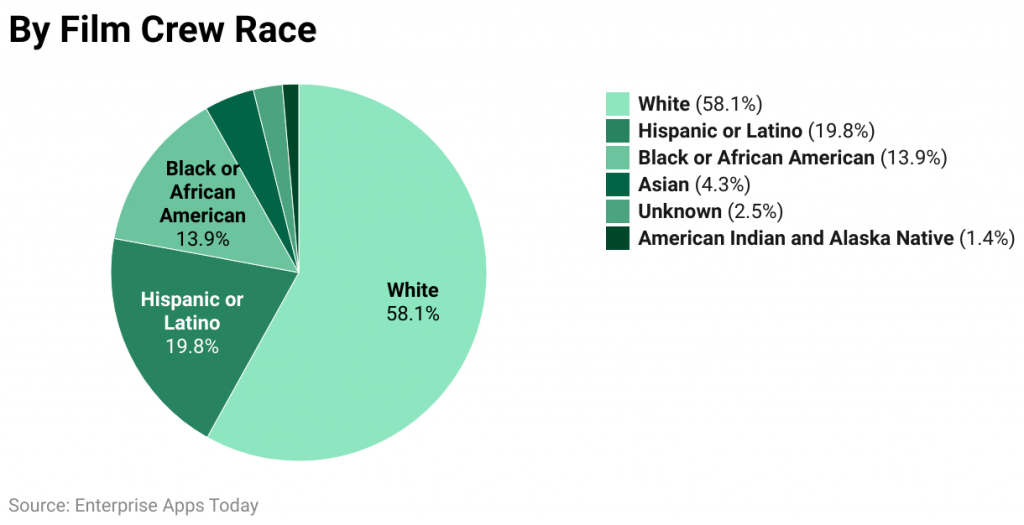
White individuals accounted for 71% of the film crew, followed by Hispanic or Latino at 19.8%.
Black or African American members represented 9% of the crew in terms of ethnic background.
Asian, American Indian, Alaska Native, and undisclosed backgrounds contributed to the overall makeup of the crew.
(Source: ZIPPIA)
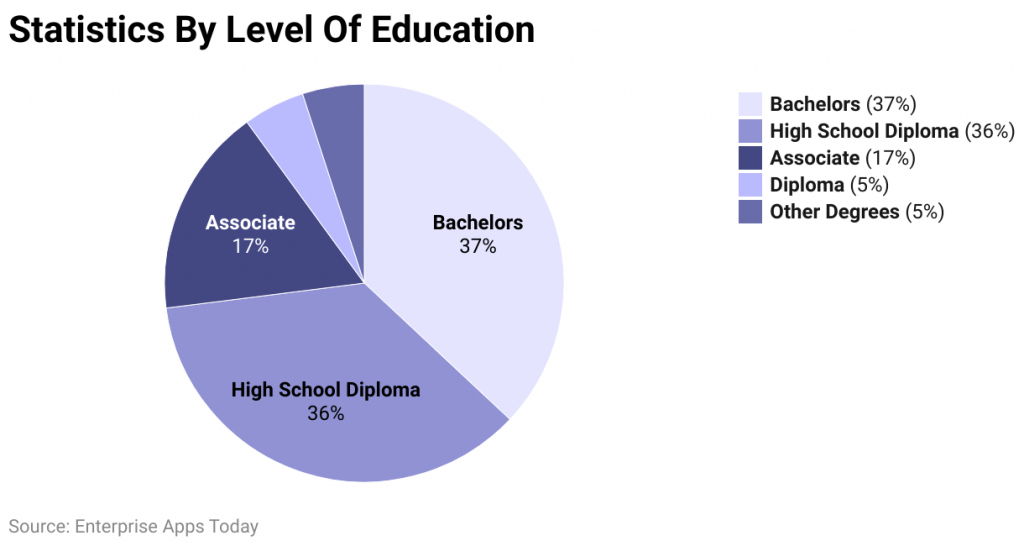
Approximately 37% of individuals in the film industry hold bachelor’s degrees, while 36% have a high school diploma.
Additionally, 17% possess an associate degree, and the remaining 10% entertain other educational backgrounds.
By A Visit Movie Theaters
Based on May 2022 data, 33% of US residents indicated occasional visits to cinema halls.
Conversely, 8% claimed to frequent movie theaters.
Moreover, 41% rarely attended movie theaters, while the remaining 18% never visited.
In 2021, global statistics revealed that 61% of adults did not go to movie theaters throughout the year.
Of those who did visit theaters, 31% went 1 to 4 times, and 9% patronized cinema halls more than 5 times.
In the same year, 53% of US residents expressed hesitancy towards cinema visits due to the pandemic.
Conversely, only 18% felt comfortable returning to movie theaters.
By Box Office
Revenue
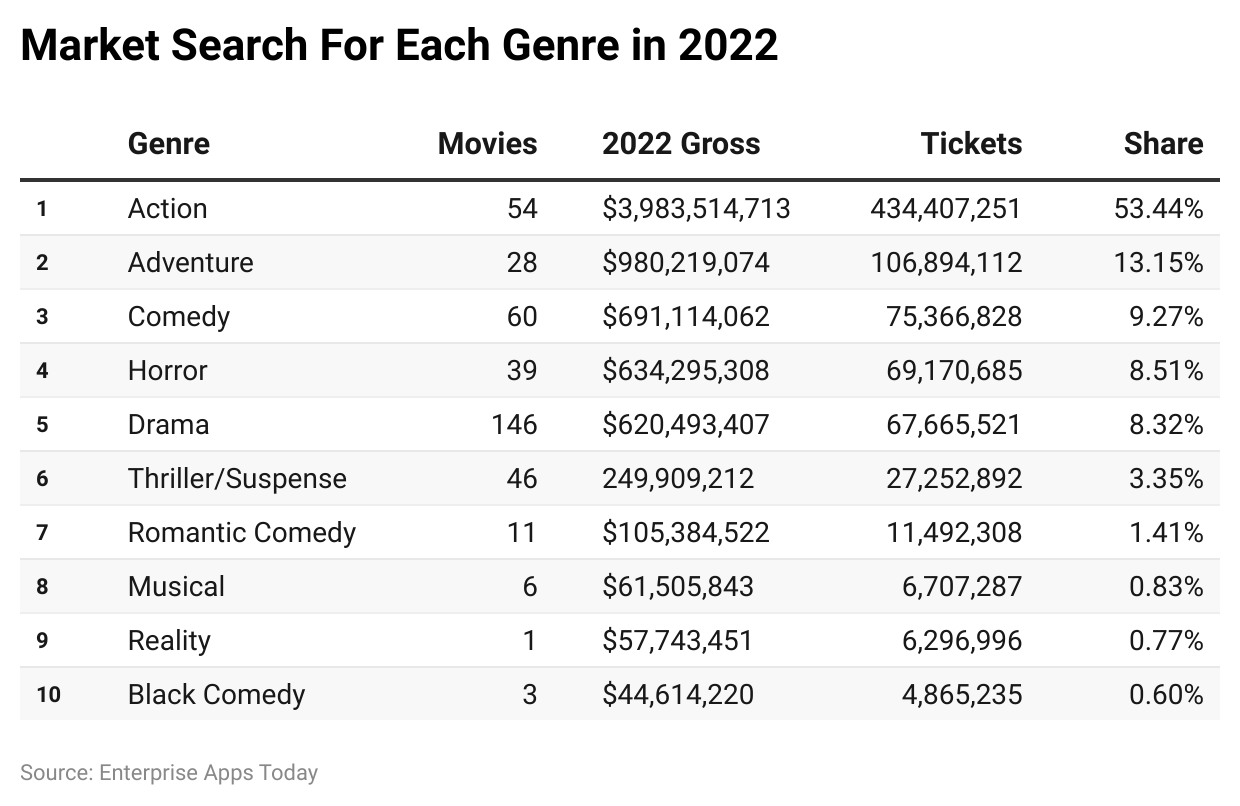
Movies released in the year 2022 show that the action genre had the highest revenue of $3,983,514,713, a market share of 53.43%, and sold around 434,407,251 tickets from 54 movie releases.
The adventure genre released 28 movies with a revenue of $980,219,074 and a market share of 13.15%, while the comedy genre had 59 movies earning $691,113,850 with a market share of 9.27%. Tickets sold were 106,894,109 for adventure and 75,366,805 for comedy.
Horror had 37 releases with a market share of 8.51%, revenue of $634,214,244, and tickets sold were 69,161,842. Drama released 144 movies with a market share of 8.33%, revenue of $621,137,428, and tickets sold reaching 67,735,748.
For the thriller/suspense genre, there were 46 releases with a market share of 3.35%, revenue of $249,909,212, and tickets sold totaling to 27,252,891.
Romantic comedy and musical genres each released 11 and 6 movies, generating revenue of $61,505,843 and $57,743,451 with market shares of 1.41% and 0.83%. Ticket sales were 11,492,308 for romantic comedy and 6,707,287 for musicals.
Reality and black comedy genres each had 1 and 3 releases, respectively. They generated revenues of $57,743,451 and $44,614,220 and sold 6,296,995 and 4,865,235 tickets, with market shares of 0.77% and 0.60%.
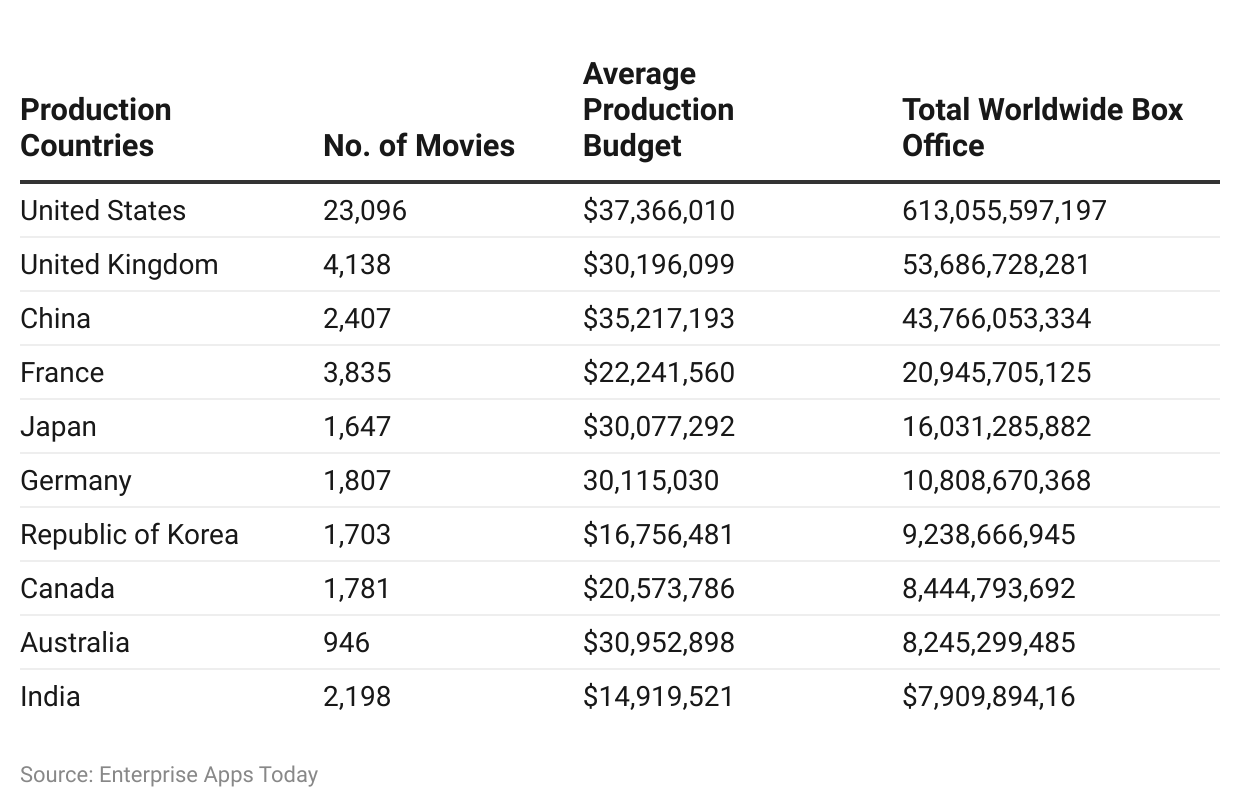
In 2022, the US led in movie production with 23,035 releases, an average budget of $37,302,936, and a global box office revenue of $612,550,083,433.
The UK and China followed with 4,123 and 2,384 releases, average budgets of $30,196,099 and $35,217,193, and box office revenues of $53,665,576,963 and $42,456,671,308 respectively.
France, Japan, and Germany also made significant contributions, each with various movie releases, budgets, and box office earnings.
Countries like Korea, Canada, Australia, and India also played a part in movie production with different numbers of releases, budgets, and box office revenues.
By The Top Movies of 2022
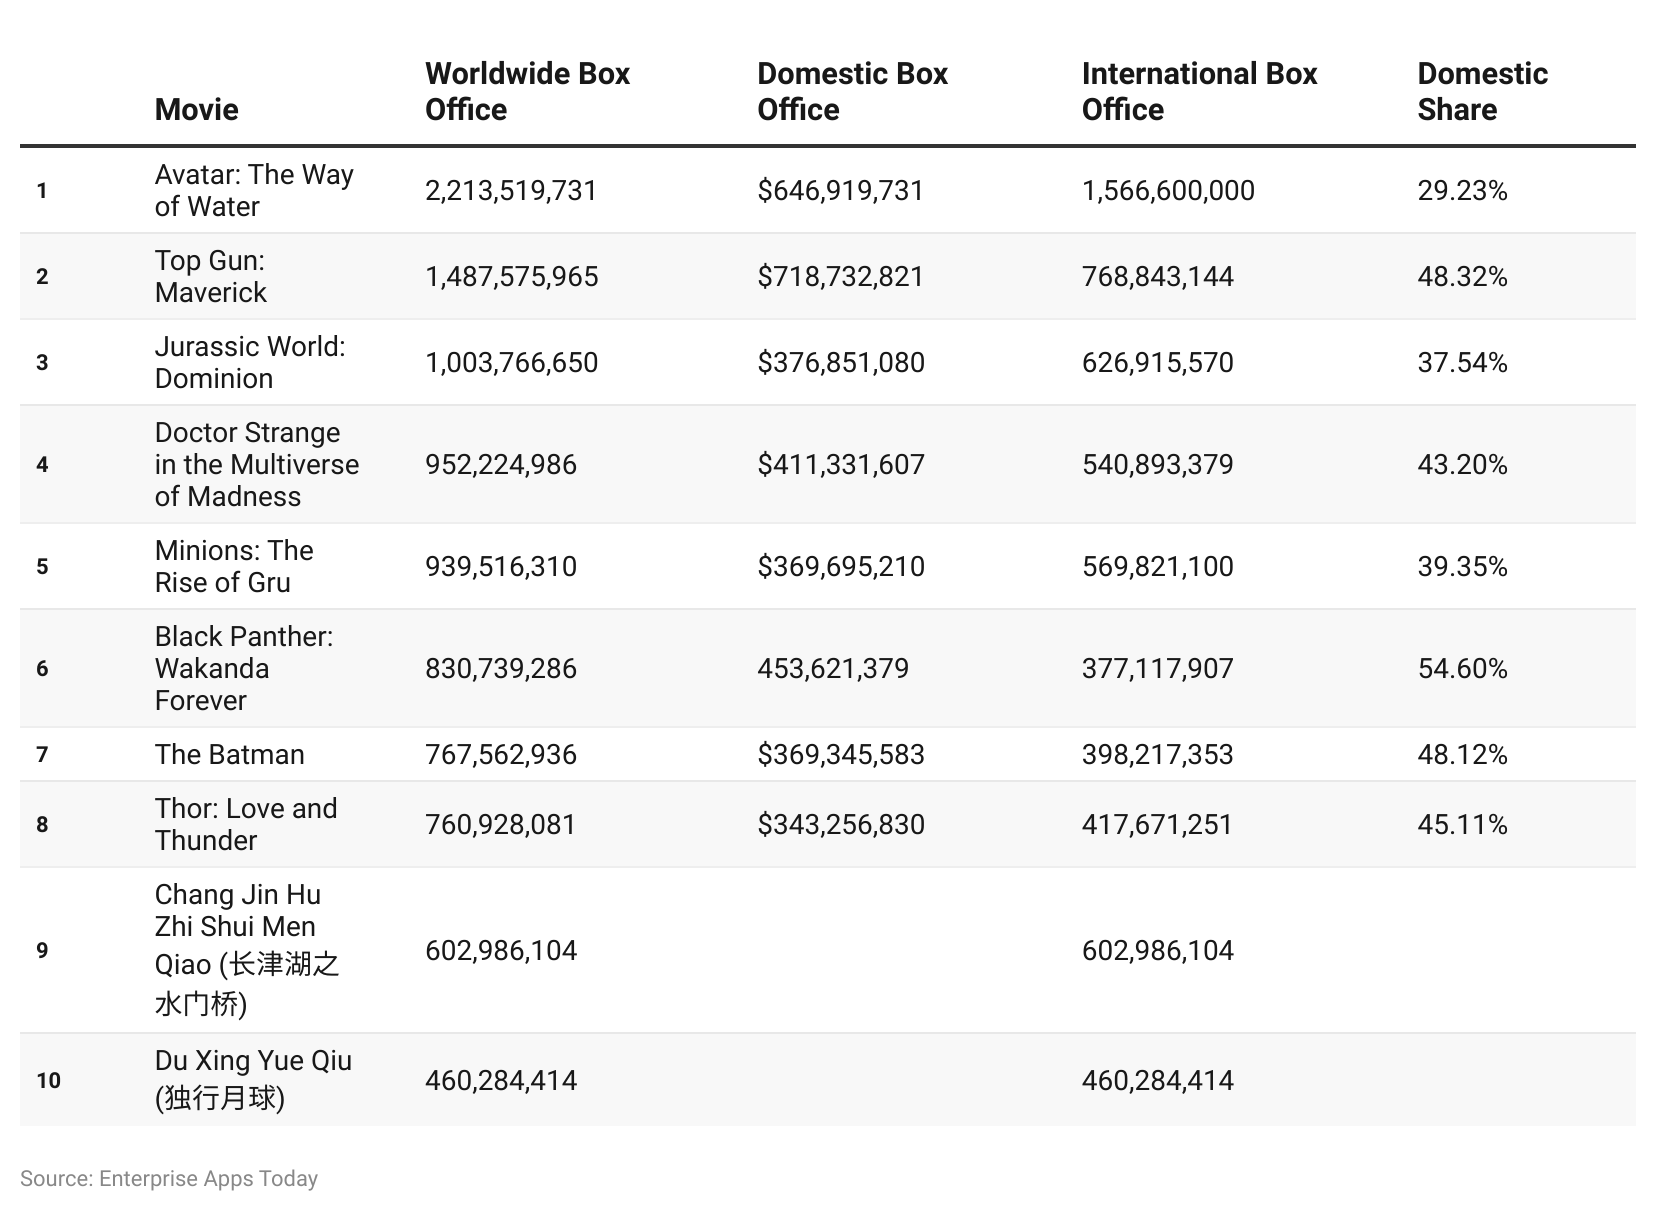
Avatar: The Way of Water led in revenue in 2022, with a domestic share of 29.37% and total earnings of $2,054,734,732 worldwide.
Top Gun: Maverick followed with $1,487,575,965 worldwide earnings and a 48.32% share at the international box office.
Several other movies like Jurassic World Dominion and Doctor Strange in the Multiverse of Madness also made significant impacts in revenue and market share.
By The Language Of Movies
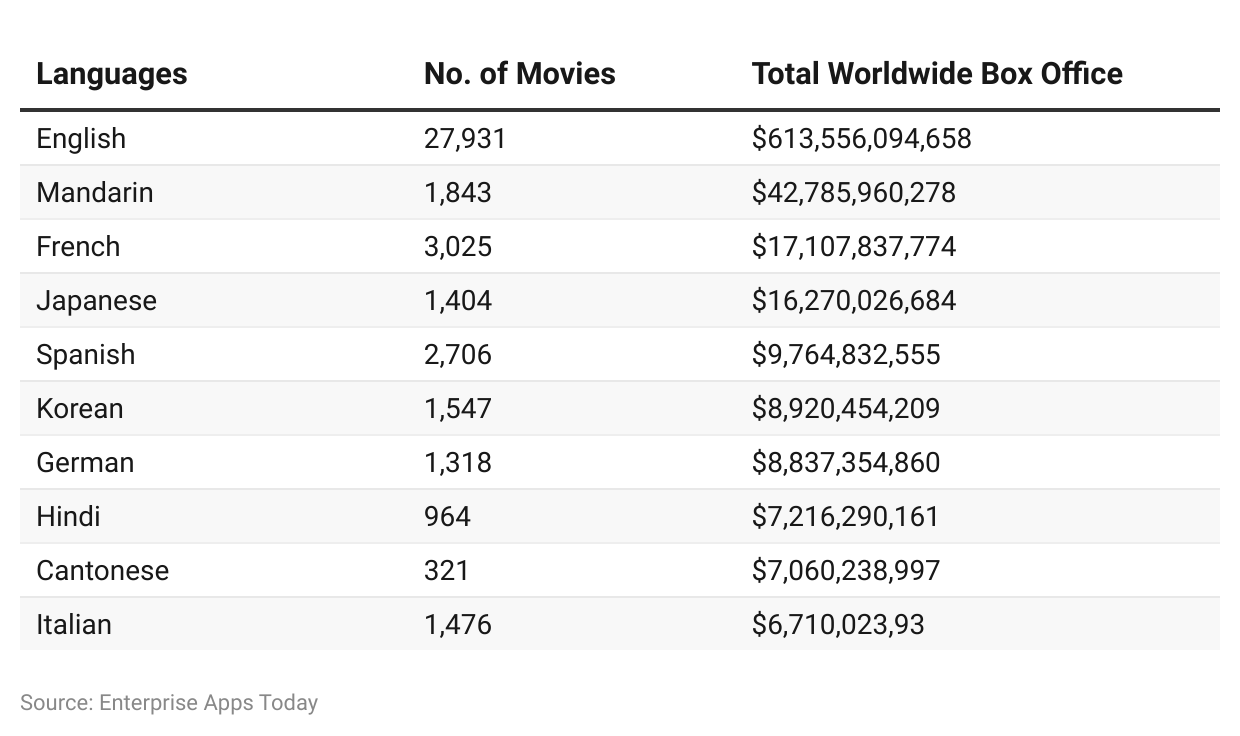
English dominated the worldwide box office with $612,486,194,772 in revenue from 27,821 releases.
Mandarin and French were significant languages in movie releases, contributing substantial revenue to the global box office.
Japanese, Spanish, Korean, German, Hindi, Cantonese, and Italian also had their shares in movie production and revenue generation.
By The Production Method
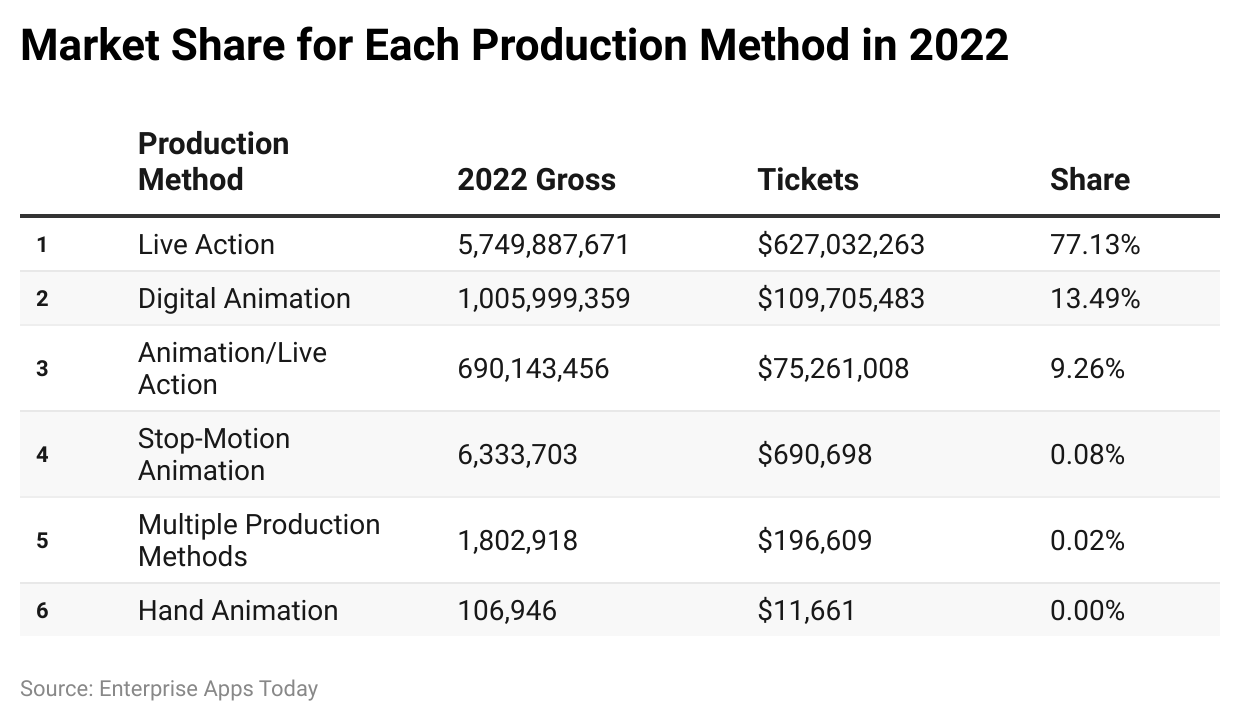 (Source: the-numbers)
Regarding Film industry statistics in 2022, the live-action category was the highest-grossing type in product method, resulting in $5,750,204,733 of overall revenue and selling 6,27,066,832 tickets in the domestic market within this genre.
In the year 2022, films using a live-action production method had the highest market share at 77.13%.
Digital animation stood as the second-largest film type by production method in the domestic market of 2022, grossing $1,005,999,359 and selling approximately 109,705,481 tickets.
Having a market share of 13.49%, digital animation held a significant position in the production method.
The third-largest product method in the domestic market was animation/live-action, which sold a total of 75,261,007 tickets, generated $690,143,456 in revenue, and held a market share of 9.26%.
Film industry statistics for 2022 also mentioned other production methods such as stop-motion animation, multiple production methods, and hand animation.
Each of the above three categories respectively sold 690,698, 196,609, and 11,661 tickets with market shares of 0.08%, 0.02%, and 0.00%.
Conclusion
Film industry statistics reveal that revenue is influenced by region, country, and film language choice, contributing to billions in earnings. Despite the pandemic’s impact, the cinema industry continues to evolve annually through technological advancements. The entertainment sector remains resilient, indicating numerous career opportunities in the years to come.
Notably, both the United States of America and India hold substantial market shares in regional movie languages. In 2022, Hindi films globally generated $7,112,680,299 in revenue, emphasizing the film industry’s global relevance in the entertainment sector.

15+ Eye-Opening Supercomputer Statistics That You Should Know In 2023

SEO Statistics By Organic Search Traffic, Ranking, Industry/Company, Business, Mobile, Platform, Country, Activity, and Satisfaction Rate

Live Chat Statistics By Usage, Demographic, Reason, Technologies Market Share, Customer Preference, Company Improvement, and Platforms
SEO Statistics By Organic Search Traffic, Ranking, Industry/Company, Business, Mobile, Platform, Country, Activity, and Satisfaction Rate
Film Industry Statistics 2024 By The Distributor, Running Time, Demographic and Box Office Revenue
2023 and 2024 data, along with forecasts for 2025, 2026, 2027, and 2028, reflect evolving trends in the industry.
Â
* This information was taken from various sources around the world, including these countries:
Australia, Canada, USA, UK, UAE, India, Pakistan, Philippines, Indonesia, Nigeria, Tanzania, Kenya, US, United Kingdom, United States of America, Malaysia, U.S., South Africa, New Zealand, Turkey, United Arab Emirates.
Afghanistan, Albania, Algeria, American Samoa, Andorra, Angola, Anguilla, Antarctica, Antigua and Barbuda, Argentina, Armenia, Aruba, Australia, Austria, Azerbaijan.
Bahamas, Bahrain, Bangladesh, Barbados, Belarus, Belgium, Belize, Benin, Bermuda, Bhutan, Bolivia, Bosnia and Herzegovina, Botswana, Bouvet Island, Brazil, British Indian Ocean Territory, Brunei Darussalam, Bulgaria, Burkina Faso, Burundi.
Cambodia, Cameroon, Canada, Cape Verde, Cayman Islands, Central African Republic, Chad, Chile, China, Christmas Island, Cocos (Keeling Islands), Colombia, Comoros, Congo, Cook Islands, Costa Rica, Cote D’Ivoire (Ivory Coast), Croatia (Hrvatska), Cuba, Cyprus, Czech Republic.
Denmark, Djibouti, Dominica, Dominican Republic, East Timor, Ecuador, Egypt, El Salvador, Equatorial Guinea, Eritrea, Estonia, Ethiopia, Falkland Islands (Malvinas), Faroe Islands, Fiji, Finland, France, Metropolitan, French Guiana, French Polynesia, French Southern Territories.
Gabon, Gambia, Georgia, Germany, Ghana, Gibraltar, Greece, Greenland, Grenada, Guadeloupe, Guam, Guatemala, Guinea, Guinea-Bissau, Guyana, Haiti, Heard and McDonald Islands, Honduras, Hong Kong, Hungary, Iceland, India, Indonesia, Iran, Iraq, Ireland, Israel, Italy.
Jamaica, Japan, Jordan, Kazakhstan, Kenya, Kiribati, North Korea, South Korea, Kuwait, Kyrgyzstan, Laos, Latvia, Lebanon, Lesotho, Liberia, Libya, Liechtenstein, Lithuania, Luxembourg.
Macau, Macedonia, Madagascar, Malawi, Malaysia, Maldives, Mali, Malta, Marshall Islands, Martinique, Mauritania, Mauritius, Mayotte, Mexico, Micronesia, Moldova, Monaco, Mongolia, Montserrat, Morocco, Mozambique, Myanmar.
Namibia, Nauru, Nepal, Netherlands, Netherlands Antilles, New Caledonia, New Zealand (NZ), Nicaragua, Niger, Nigeria, Niue, Norfolk Island, Northern Mariana Islands, Norway.
Oman, Pakistan, Palau, Panama, Papua New Guinea, Paraguay, Peru, Philippines, Pitcairn, Poland, Portugal, Puerto Rico, Qatar, Reunion, Romania, Russia, Rwanda, Saint Kitts and Nevis, Saint Lucia, Saint Vincent and The Grenadines, Samoa, San Marino, Sao Tome and Principe.
Saudi Arabia, Senegal, Serbia, Seychelles, Sierra Leone, Singapore, Slovakia, Slovenia, Solomon Islands, Somalia, South Africa, South Georgia and South Sandwich Islands, Spain, Sri Lanka, St. Helena, St. Pierre and Miquelon, Sudan, Suriname, Svalbard and Jan Mayen Islands, Swaziland, Sweden, Switzerland, Syria.
Taiwan, Tajikistan, Tanzania, Thailand, Togo, Tokelau, Tonga, Trinidad and Tobago, Tunisia, Turkey, Turkmenistan, Turks and Caicos Islands, Tuvalu, Uganda, Ukraine, United Arab Emirates (UAE), UK (United Kingdom), USA (United States of America, U.S.), US Minor Outlying Islands.
Uruguay, Uzbekistan, Vanuatu, Vatican City State (Holy See), Venezuela, Vietnam, Virgin Islands (British), Virgin Islands (US), Wallis and Futuna Islands, Western Sahara, Yemen, Yugoslavia, Zaire, Zambia, Zimbabwe.
Film Industry Statistics 2024 By The Distributor, Running Time, Demographic and Box Office Revenue
September 10, 2024
Source link : http://www.bing.com/news/apiclick.aspx?ref=FexRss&aid=&tid=66ea7d90fa2745d7802d53bbb6f3e69b&url=https%3A%2F%2Fhollywoodgazette.com%2Ffilm-industry-statistics-html%2F&c=11066425189205993463&mkt=en-us
Author :
Publish date : 2024-09-01 13:00:00
Copyright for syndicated content belongs to the linked Source.


