andresr / Getty Images
The U.S. housing market has been through enormous changes in the past five years, with high home prices and mortgage rates, but lower inventory. This can make it hard for people ready to buy to know when and where to do so.
Be Aware: These 5 Cities Are Becoming Unpopular With Baby Boomers: Here’s Why
Consider This: 7 Reasons You Must Speak To a Financial Advisor Before Spending $50,000 or More
If you’re only looking at the more obvious housing markets, you might be missing out on hidden gems in smaller markets where home values are rising but prices are not out of reach. These small towns also have decent median incomes and affordable costs of living.
To find the top 25 hidden gem housing markets, GOBankingRates used data from the Zillow Home Value Index from June 2024, the US Census American Community Survey, Sperling’s BestPlaces, the Bureau of Labor Statistics’ Consumer Expenditure Survey and AreaVibes.
Ranked in ascending order, check out these 25 cities where you might just want to consider buying a home while you still can.
Visitor7 / Wikimedia Commons
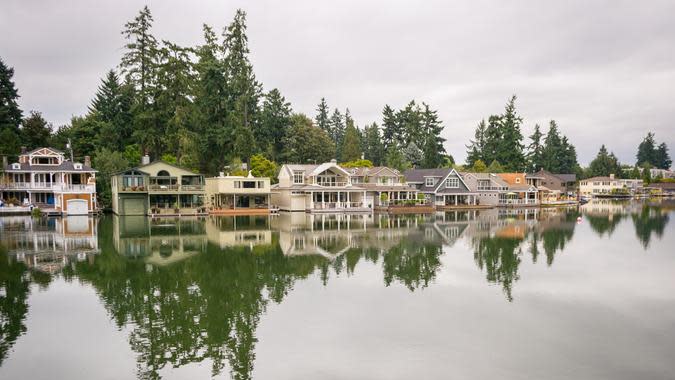
25. Lakeview, Oregon
Population total: 2,947
Household median income: $52,574
Single family home average value: $184,409
Difference from state average home value: $(327,510)
Monthly expenditures: $1,759
Livability score: 74
Pictured: Lake Oswego
Check Out: 20 Best Cities Where You Can Buy a House for Under $100K
Discover More: 10 Countries To Live Outside the US That Are So Cheap You Could Quit Your Job
Earning passive income doesn’t need to be difficult. You can start this week.
Richard A. McGuirk / Shutterstock.com
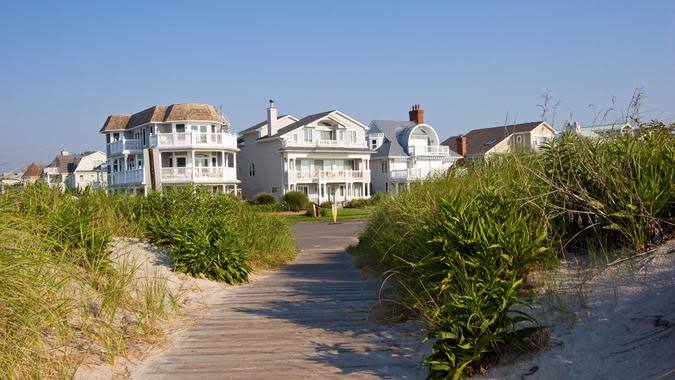
24. Merchantville, New Jersey
Population total: 3,800
Household median income: $72,375
Single family home average value: $318,090
Difference from state average home value: $(236,125)
Monthly expenditures: $2,023
Livability score: 83
Pictured: Trenton
Read Next: 5 Types of Homes That Will Plummet in Value in 2024
©Shutterstock.com
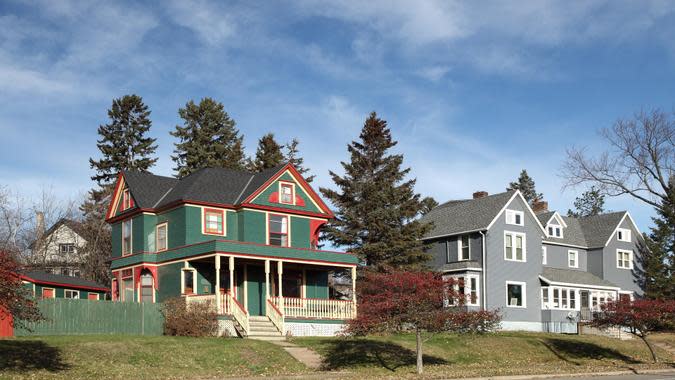
23. Wells, Minnesota
Population total: 2,278
Household median income: $55,337
Single family home average value: $129,085
Difference from state average home value: $(217,802)
Monthly expenditures: $1,690
Livability score: 78

Jon Bilous / Shutterstock.com
22. Glasgow, Montana
Population total: 3,208
Household median income: $65,850
Single family home average value: $258,448
Difference from state average home value: $(214,903)
Monthly expenditures: $1,794
Livability score: 81
Lucas Migliorelli / Wikimedia Commons CC-BY-SA 3
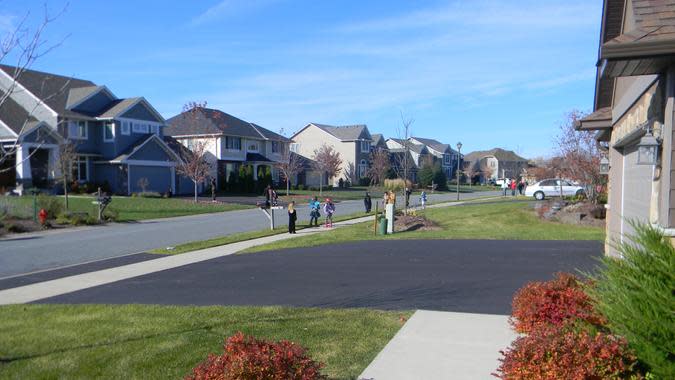
21. Tracy, Minnesota
Population total: 2,006
Household median income: $63,201
Single family home average value: $129,099
Difference from state average home value: $(217,788)
Monthly expenditures: $1,666
Livability score: 77
Pictured: Eden Prairie
J. Michael Jones / Getty Images
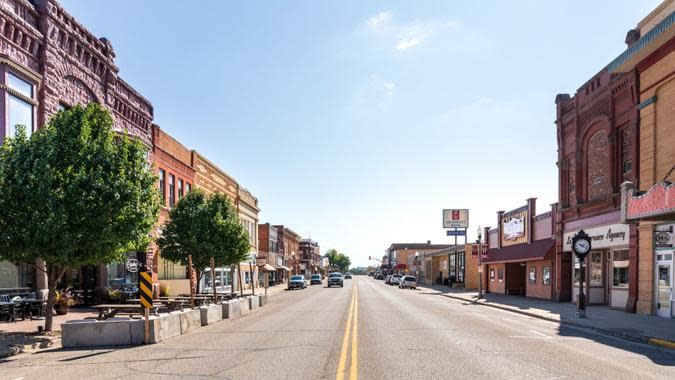
20. Luverne, Minnesota
Population total: 4,910
Household median income: $66,394
Single family home average value: $247,060
Difference from state average home value: $(99,826)
Monthly expenditures: $1,632
Livability score: 85
Story continues
Trending Now: 5 Cities Where Homes Will Be a Total Steal in 2 Years
halbergman / Getty Images/iStockphoto
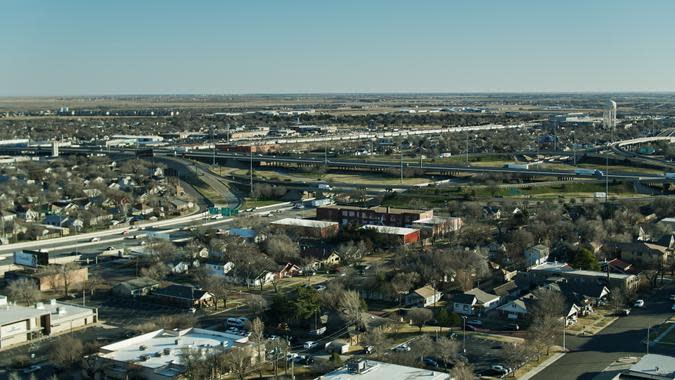
19. Panhandle, Texas
Population total: 2,743
Household median income: $83,867
Single family home average value: $181,944
Difference from state average home value: $(127,927)
Monthly expenditures: $1,823
Livability score: 83
Pictured: Amarillo
Boogich / Getty Images/iStockphoto
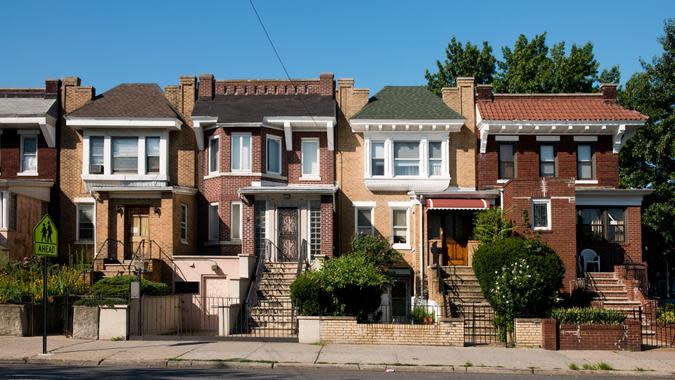
18. Liverpool, New York
Population total: 2,331
Household median income: $70,556
Single family home average value: $259,919
Difference from state average home value: $(195,837)
Monthly expenditures: $2,038
Livability score: 85
Pictured: Queens
RyanCSlimakPhoto / Getty Images/iStockphoto
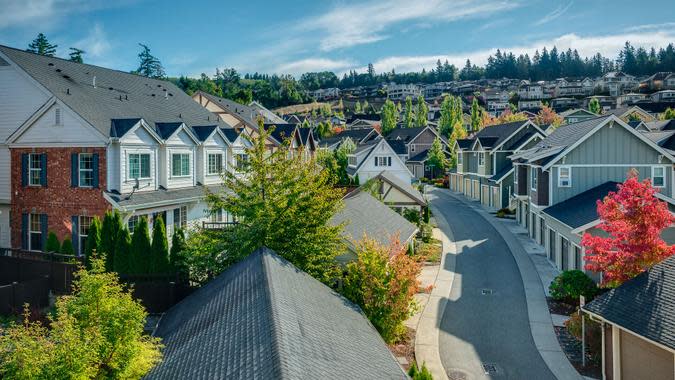
17. Montesano, Washington
Population total: 4,124
Household median income: $57,500
Single family home average value: $388,620
Difference from state average home value: $(228,045)
Monthly expenditures: $1,877
Livability score: 85
Pictured: Seattle

mandritoiu / Shutterstock.com
16. Laurel Springs, New Jersey
Population total: 8,695
Household median income: $103,379
Single family home average value: $361,092
Difference from state average home value: $(193,123)
Monthly expenditures: $1,983
Livability score: 84
Pictured: Trenton
For You: 5 Worst Florida Cities To Buy Property in the Next 5 Years, According to Real Estate Agents
DenisTangneyJr / Getty Images/iStockphoto
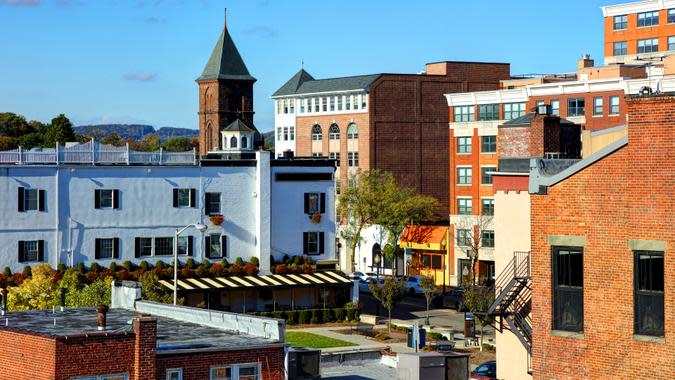
15. Audubon, New Jersey
Population total: 8,695
Household median income: $103,379
Single family home average value: $361,092
Difference from state average home value: $(193,123)
Monthly expenditures: $1,983
Livability score: 84
Pictured: Morristown
Sean Pavone / Shutterstock.com
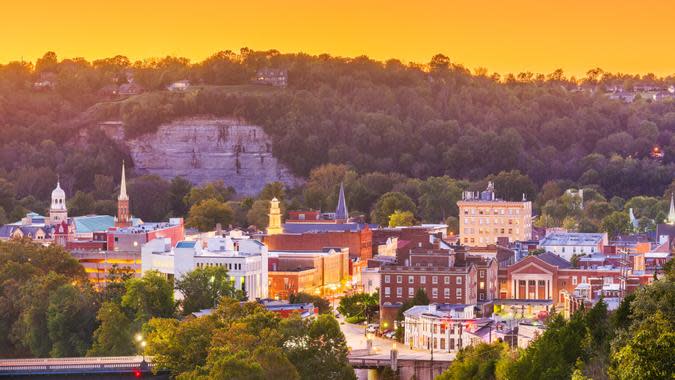
14. Wellington, Kentucky
Population total: 443
Household median income: $103,333
Single family home average value: $137,389
Difference from state average home value: $(74,855)
Monthly expenditures: $1,971
Livability score: 86
Pictured: Frankfort
Hundley_Photography / Getty Images/iStockphoto
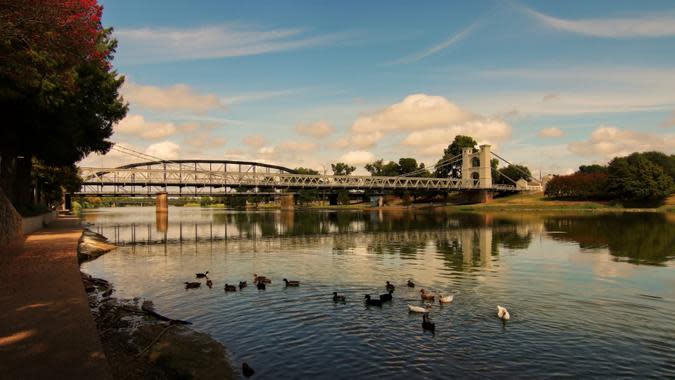
13. Friona, Texas
Population total: 4,125
Household median income: $67,837
Single family home average value: $135,379
Difference from state average home value: $(174,492)
Monthly expenditures: $1,715
Livability score: 81
Pictured: Waco
PhilAugustavo / Getty Images/iStockphoto
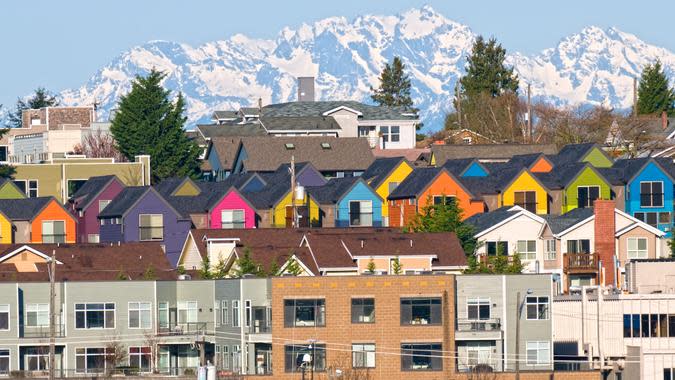
12. Ephrata, Washington
Population total: 8,419
Household median income: $57,958
Single family home average value: $320,054
Difference from state average home value: $(296,611)
Monthly expenditures: $1,712
Livability score: 79
Pictured: Seattle
Learn More: 6 Best Florida Suburbs To Buy Property in the Next 5 Years, According to Real Estate Agents
benedek / Getty Images
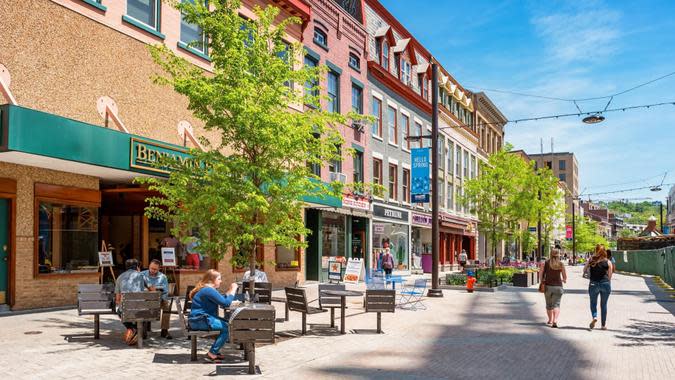
11. Fredonia, New York
Population total: 9,710
Household median income: $48,855
Single family home average value: $197,723
Difference from state average home value: $(258,033)
Monthly expenditures: $1,837
Livability score: 82
Pictured: Ithaca
SWKrullImaging / Getty Images
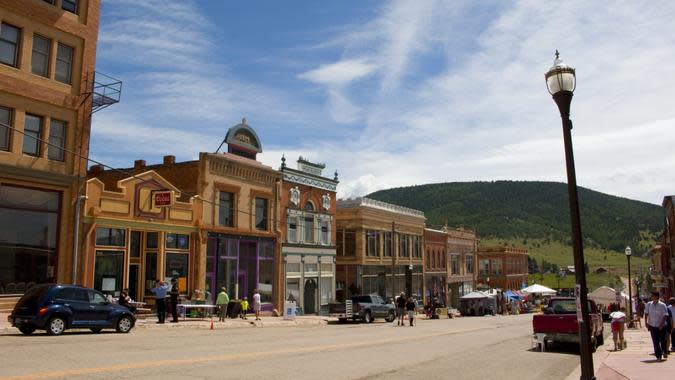
10. Julesburg, Colorado
Population total: 1,187
Household median income: $37,232
Single family home average value: $165,756
Difference from state average home value: $(398,453)
Monthly expenditures: $1,823
Livability score: 75
Pictured: Victor

Kim Grosz / Getty Images
9. Shelby, Montana
Population total: 3,058
Household median income: $51,667
Single family home average value: $181,948
Difference from state average home value: $(291,403)
Monthly expenditures: $1,756
Livability score: 79
CatLane / iStock.com
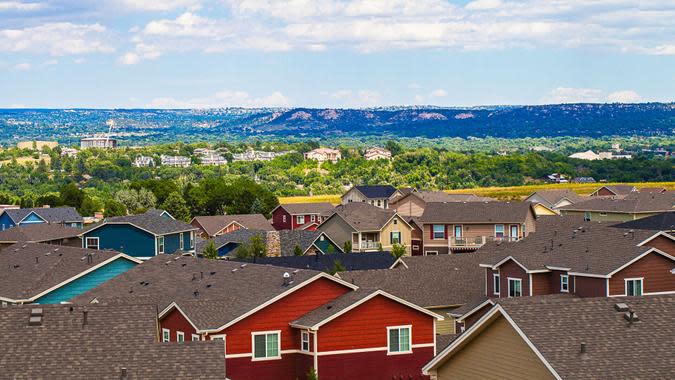
8. Las Animas, Colorado
Population total: 2,421
Household median income: $45,355
Single family home average value: $101,265
Difference from state average home value: $(462,943)
Monthly expenditures: $1,842
Livability score: 70
Pictured: Colorado Springs
Explore More: 7 Worst States To Buy Property in the Next 5 Years, According to Real Estate Agents
DenisTangneyJr / Getty Images/iStockphoto
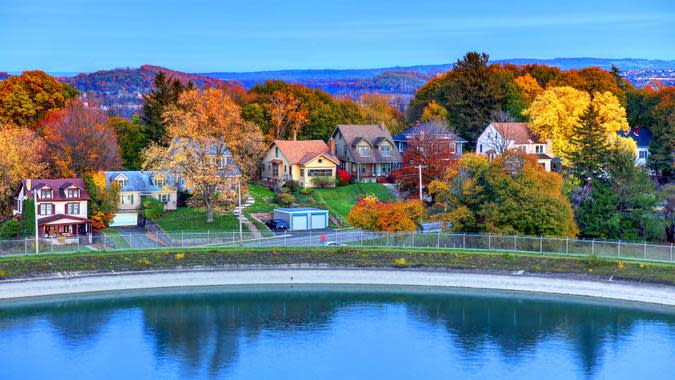
7. East Syracuse, New York
Population total: 3,065
Household median income: $52,794
Single family home average value: $225,891
Difference from state average home value: $(229,866)
Monthly expenditures: $2,056
Livability score: 88
PBallay / iStock.com
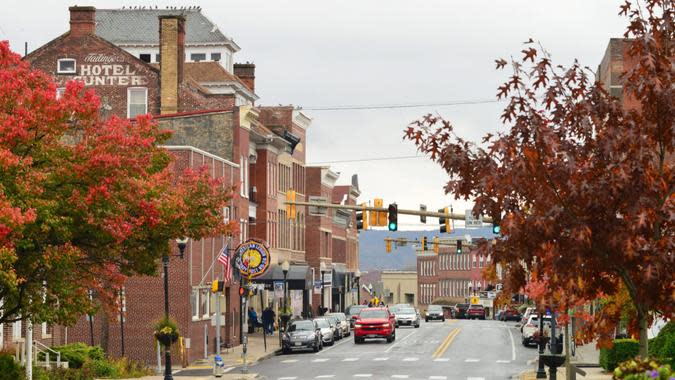
6. Frostburg, Maryland
Population total: 7,118
Household median income: $44,658
Single family home average value: $175,076
Difference from state average home value: $(259,685)
Monthly expenditures: $1,764
Livability score: 84
Jasperdo / Flickr.com
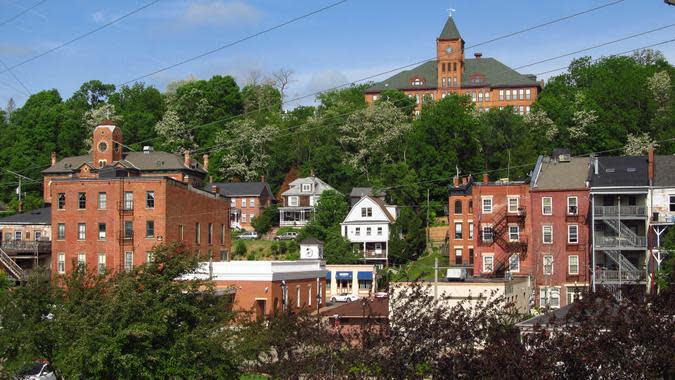
5. Jerome, Illinois
Population total: 2,194
Household median income: $52,083
Single family home average value: $143,285
Difference from state average home value: $(132,504)
Monthly expenditures: $1,902
Livability score: 92
Pictured: Galena
Mbrickn / Wikimedia Commons
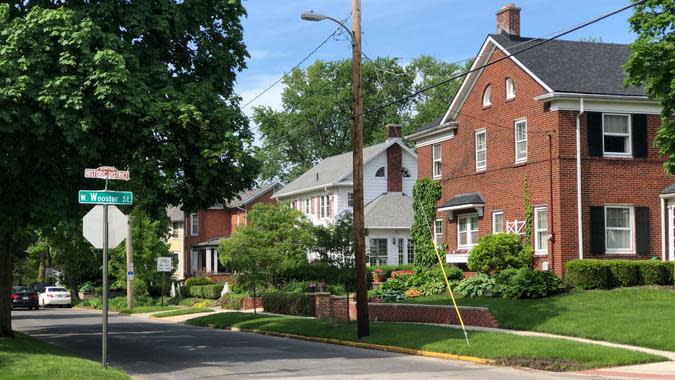
4. Sherwood, Ohio
Population total: 3,408
Household median income: $140,788
Single family home average value: $171,660
Difference from state average home value: $(65,495)
Monthly expenditures: $1,712
Livability score: 86
Pictured: Bowling Green
Find Out: 8 Places Where Houses Are Suddenly Major Bargains
©Shutterstock.com
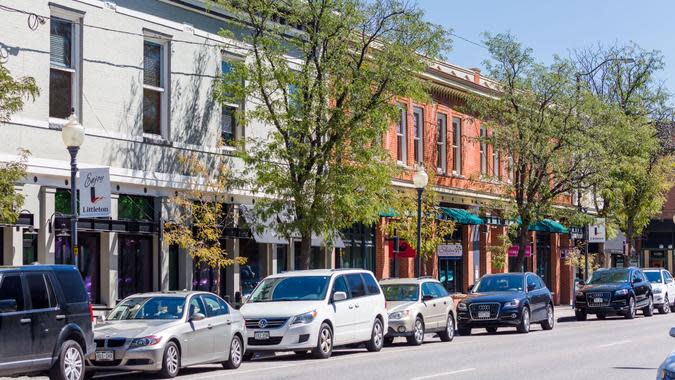
3. Rocky Ford, Colorado
Population total: 3,850
Household median income: $31,418
Single family home average value: $150,231
Difference from state average home value: $(413,977)
Monthly expenditures: $1,808
Livability score: 79
Pictured: Littleton
©iStock.com
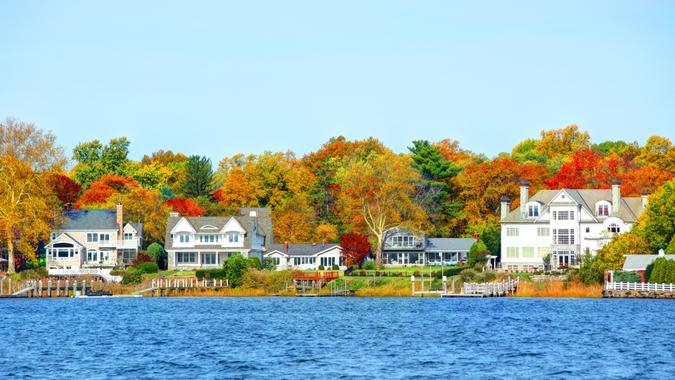
2. Woodlynne, New Jersey
Population total: 2,904
Household median income: $68,125
Single family home average value: $185,326
Difference from state average home value: $(368,888)
Monthly expenditures: $1,980
Livability score: 81
Pictured: Red Bank

Teacherdad48 / Getty Images
1. Dayton, Washington
Population total: 2,763
Household median income: $68,671
Single family home average value: $253,494
Difference from state average home value: $(363,171)
Monthly expenditures: $1,721
Livability score: 80
Methodology: For this study, GOBankingRates analyzed cities around the country to find the best hidden housing markets of 2024. First GOBankingRates found the average single family home value for cities across the country along with the statewide average single family home value in order to compare each cities home values to their state average home values. By using the Zillow Home Value Index from June 2024, the average single family home value was included for each city. By assuming a 10% down payment and using the national average 30-year fixed mortgage rate, the average mortgage cost can be found. Cities with an average home value $50,000 under their statewide averages were kept for this study to showcase housing markets that may be undervalued. For each city a number of factors were found including: total population, total households, population ages 65 and over and household median income all sourced from the US Census American Community Survey. The average expenditure cost can be calculated by using each city’s cost of living indexes as sourced from Sperlings BestPlaces and the national average expenditure costs for all residents as sourced from the Bureau of Labor Statistics Consumer Expenditure Survey. The total cost of living can be calculated using the average mortgage and expenditure costs. Cities with more and less than 10,000 population were sorted into two lists to find the best hidden gems in smaller cities and larger cities. The livability index was sourced from AreaVibes for each city and all cities under 70 were removed for this study as those places represent places that have a lower quality of life and are not hidden gems. The household median income was scored and weighted at 1.00, the difference in single family home values from state home values was scored and weighted at 2.00, the average mortgage cost was scored and weighted at 1.00, the expenditure cost was scored and weighted at 1.00 and the livability index was scored and weighted at 2.00. All the scores were summed and sorted to show the best hidden gem housing markets of 2024. All data was collected on and is up to date as of Aug. 5th, 2024.
More From GOBankingRates
This article originally appeared on GOBankingRates.com: America’s 25 Best Hidden Gem Housing Markets of 2024
Source link : http://www.bing.com/news/apiclick.aspx?ref=FexRss&aid=&tid=66d854b6038f4a5eb4d394ddcdabca16&url=https%3A%2F%2Ffinance.yahoo.com%2Fnews%2Famerica-25-best-hidden-gem-123041519.html&c=1769098894517858510&mkt=en-us
Author :
Publish date : 2024-09-04 01:30:00
Copyright for syndicated content belongs to the linked Source.


